Climate & Energy

Writing on electric vehicles, the grid, decarbonization, and climate solutions.

Hacking Windmills

Staggs sat in the front seat and opened a MacBook Pro while the researchers looked up at the towering machine. Like the dozens of other turbines in the field, its white blades—each longer than a wing of a Boeing 747—turned hypnotically. Staggs typed into his laptop's command line and soon saw a list of IP addresses representing every networked turbine in the field. A few minutes later he typed another command, and the hackers watched as the single turbine above them emitted a muted screech like the brakes of an aging 18-wheel truck, slowed, and came to a stop.

Source: Researchers Found They Could Hack Entire Wind Farms | WIRED

In a networked world, you need cyber security everywhere. Especially when physical access is so easy to get. The BeyondCorp model of not trusting the network is a really good starting place for systems like this.

Related: Japan to Create the World's Largest Floating Wind Turbine | PCMag · The Great Machines - Vacationing in the Age of Climate Solutions part 3 · Ruby Typed Accessors

It’s about 50 degrees warmer than normal near the North Pole, yet again - The Washington Post

Extreme temperature spikes such as this one have occurred multiple times in the past two winters, whereas they only previously occurred once or twice per decade in historical records according to research published in the journal Nature.

As Mashable science writer Andrew Freedman put it: “Something is very, very wrong with the Arctic climate.”

Source: It’s about 50 degrees warmer than normal near the North Pole, yet again - The Washington Post

As someone that follows the science, I definitely understand the difference between weather and climate. However, it takes climate change to create aberrations this extreme, this often.

This is all very real. It is unfortunate that many of our elected representatives don't agree with the science.

Related: Much warmer summers · Two Degrees: Cities, Architecture and Our Changing Environments · Climate Giving

One of the largest icebergs recorded

The crack in Larsen C now reaches over 100 miles in length, and some parts of it are as wide as two miles. The tip of the rift is currently only about 20 miles from reaching the other end of the ice shelf.

Once the crack reaches all the way across the ice shelf, the break will create one of the largest icebergs ever recorded, according to Project Midas, a research team that has been monitoring the rift since 2014. Because of the amount of stress the crack is placing on the remaining 20 miles of the shelf, the team expects the break soon.

Source: A Crack in an Antarctic Ice Shelf Grew 17 Miles in the Last Two Months - The New York Times

Climate Change is real, and keeps on chugging. The visuals in the NY Times article are quite impressive and give you a more visceral sense of what is going on.

Related: Japan to Create the World's Largest Floating Wind Turbine | PCMag · NYTimes: Who owns that science data · First crack in the gene patent industry

Ambient Radio Weather Network

Nearly 7 years ago I started down a project to use existing oregon scientific weather sensors to collect temperature data throughout our house. The basic idea is that Oregon Scientific weather sensors all communicate unencrypted over 433Mhz wireless. With a receiver you can capture that data yourself and put it into other systems.

4th Generation of the Project

Over the last 7 years, and many iterations, lots has changed

  • Switched from heyu to directly talking to the rfxcom port in python
  • Moved from running on primary server to running on raspberry pi
  • Moved from storing data in mysql to publishing on MQTT bus
  • Abandoned the display layer entirely in favor of Home Assistant integration
  • Published the project on github and pypi

All of these have made the whole project a much more reasonable scope, and easier to understand what it is doing. So lets dive into some of the reasons for the more major ones.

Giving up on the Display Layer

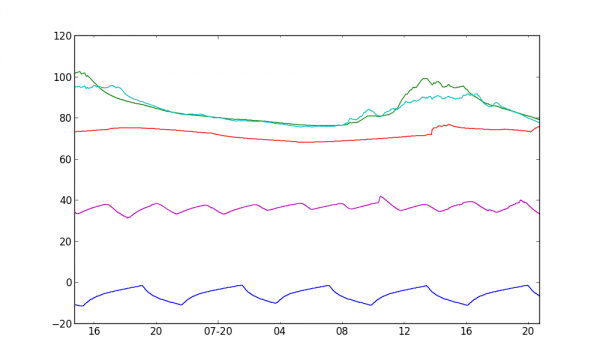
When this project started the UI for it was a read only set of rrdtool generated graphs. One of the things you realize after a while is that while graphs are nice to understand trends, it's not enough. Min, Max, Current temperature is important, especially if you are using this information to understand tuning your HVAC system. How much differential is there between 2 points in the house right now. I started to imagine what the interface would have to look like to get all the data I wanted, and that became a giant visualization code base I never could get around to writing. But then along came Home Assistant.

Home Assistant is an open source home automation hub written in python. It already has a UI for displaying temperature sensors.

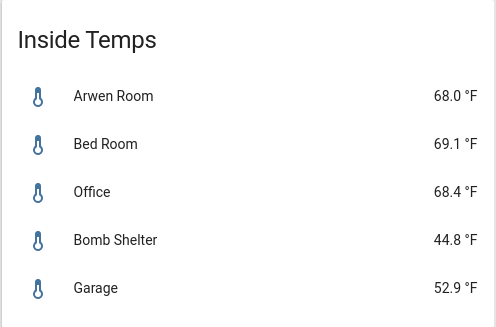
This also includes a detailed view: 
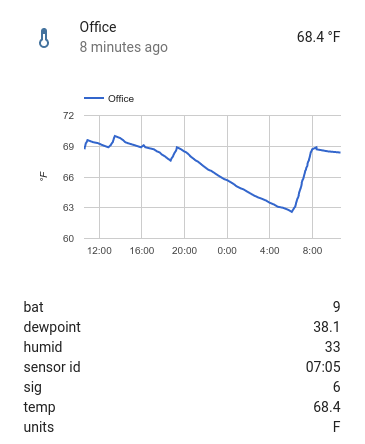
While not perfect, that's a huge ton of work that I don't need to do any more. Yay! And better yet, by getting data into Home Assistant, these sensors can be used to trigger other parts of home automation. Even if that's just sending out an alert because a temperature went over a threshold.

MQTT

Ok, so now I am building a system with no UI, so the next question is how to get the data from this device into Home Assistant. For that I changed the architecture to being basically stateless and publishing data via MQTT. MQTT is a lightweight message bus standard designed with IoT applications in mind. The protocol is pretty simple, there are multiple brokers that implement it, and there are client libraries for everything you can imagine (including arduino). The ARWN project now is largely a relay that is blocked on the serial port reading data frames from the weather sensors and immediately publishing them out to MQTT

ribos:# mosquitto_sub -h 10.42.0.3 -t arwn/# -v
arwn/totals/rain {"bat": 9, "sensor_id": "96:00", "timestamp": 1484110832, "rate": 0.0, "sig": 7, "units": "in", "total": 25.49}
arwn/status {"status": "alive", "timestamp": 1483883801}
arwn/temperature/Arwen Room {"bat": 9, "sensor_id": "ce:08", "sig": 6, "temp": 67.8, "dewpoint": 41.3, "timestamp": 1484235988, "units": "F", "humid": 38.0}
arwn/temperature/Bomb Shelter {"bat": 9, "sensor_id": "e3:02", "sig": 5, "temp": 44.8, "dewpoint": 22.0, "timestamp": 1484235991, "units": "F", "humid": 40.0}
arwn/temperature/Outside {"bat": 9, "sensor_id": "ec:01", "sig": 6, "temp": 51.6, "dewpoint": 51.1, "timestamp": 1484235994, "units": "F", "humid": 98.0}
arwn/rain {"bat": 9, "sensor_id": "96:00", "sig": 6, "units": "in", "timestamp": 1484235994, "total": 26.07, "rate": 0.0}
arwn/rain/today {"timestamp": 1484235994, "since_midnight": 0.5800000000000018}
arwn/temperature/Freezer {"bat": 9, "sensor_id": "a9:04", "sig": 4, "temp": -5.1, "dewpoint": -32.5, "timestamp": 1484235996, "units": "F", "humid": 24.0}
arwn/wind {"bat": 9, "sensor_id": "33:00", "sig": 5, "timestamp": 1484235998, "units": "mph", "gust": 0.0, "speed": 0.0, "direction": 157}
arwn/temperature/Garage {"bat": 9, "sensor_id": "e9:04", "sig": 7, "temp": 52.9, "dewpoint": 10.6, "timestamp": 1484236000, "units": "F", "humid": 18.0}
arwn/wind {"bat": 9, "sensor_id": "33:00", "sig": 5, "timestamp": 1484236012, "units": "mph", "gust": 0.0, "speed": 0.0, "direction": 157}
arwn/barometer {"pressure": 1012, "bat": 9, "sensor_id": "f6:00", "sig": 6, "units": "mbar", "timestamp": 1484236013}
arwn/temperature/Refrigerator {"bat": 9, "sensor_id": "f6:00", "sig": 6, "temp": 36.3, "dewpoint": 7.9, "timestamp": 1484236013, "units": "F", "humid": 30.0}

You can think of MQTT as a key / value bus. You publish on a topic, like 'arwn/temperature/Refrigerator' with an arbitrary payload. In my case I'm sending a json blob with all the relevant sensor data, as well as a timestamp. There is no timestamping inherent in MQTT, so if you care about when an event showed up, you have to insert the timestamp yourself in the payload.

I picked MQTT because Home Assistant already had very good support for it (while the primary message bus remains a python internal one, MQTT is strongly integrated in the project). Other open source projects like OpenHAB use MQTT as their primary bus. Bus architectures aren't a new thing, but the growth of the IoT space is making them even more relevant today.

There is code in Home Assistant now that will discover that that you've got ARWN running, and dynamically represent all the sensors it finds.

Even Better Dashboards

Home Assistant is limited by what it can store and what it can display. Fortunately it also can pump the data on it's bus into other systems as well. This include graphite and grafana. 
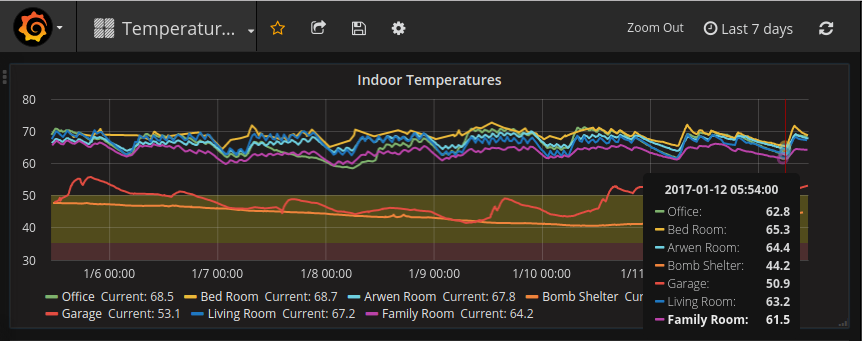
Those are SVG by default and fully interactive, so you can mouse over points and get dropdowns about all the data at those points. It can be exported to PNG files as well.

Going forward

Since I started this project, there has been a whole revolution in software defined radio. For this project to be useful to people other than myself, the next step is to be able to pull the 433Mhz off an SDR  (which runs $20) instead of the rfxcom (which is about $120).

There are definitely pieces of Home Assistant integration to make better. One of which is to expose the rain data in Home Assistant at all. The other is a UX element to build a better way to visualize current wind / temp / rain in Home Assistant. That would be a new polymer component, which I haven't yet had time to dive into.

It's also been hugely valuable in the recent insulation work we got done, as I've got some data showing how effectively it changed the dynamics of the upstairs.

If you are interested in learning more, leave a comment/question, or checkout the code on github.

Related: Home Assistant · Weather Station Progress · MQTT, Kubernetes, and CO2 in NY State

Only in Japan: Manmade Meteor Shower

After previous missteps, Tokyo needs their hosting of the Olympics to not only go smoothly, but to wow visitors in order to regain some face. If Japan-based research company Star-ALE has their way, they'll be the ones to provide the opening ceremony show-stopper that will get things off to a fantastical start—by way of a manmade meteor shower lighting up the night sky.

Source: Fireworks of the Future? Startup Looks to Launch Manmade Meteor Shower for Tokyo Olympics Opening Ceremony - Core77

It's about $8M in pellets, which for Olympic style fireworks isn't crazy, plus launch costs. But the idea that a manmade meteor shower might actually be part of big events in the future is pretty crazy.

Related: Is it a Shower or a Tardis? · Wild Web Weekend · The miracle of a billion cameras

Drones Stymie Rhino Poachers

Poaching is a threat to the survival of rhinos worldwide, and anti-poaching efforts have always been one step behind. Now, park rangers in South Africa have a leg up. John Petersen from the Air Shepherd program tells host Steve Curwood how the power of predictive analytics combined with drone technology could help to rescue the rhinos.

Source: Living on Earth: Drones Stymie Rhino Poachers

Very cool effort to re-purpose predictive analytics systems that were designed to find roadside bombs, to figure out where poachers are likely to be, then fly drones to find them. Initial results are really promising. No Rhinos were taken in the protected area during their 6 month trial, down from 12 - 14 a month previously.

Related: Encryption, or lack there of, in military drones · Size of Africa · Maybe it has more to do with never being exposed to nature

Weather Station Progress

(Note, this old post is background on some of the things I was doing here before.) A few weeks ago I lost my rfxcom receiver during a lightning storm. Which meant my old weather station reporting on http://home.dague.net went defunct. My plan had already been to move away from that code (some incredibly hacky and fragile ruby) and do this over again less hacky in python on a raspberry pi. I'd even ordered and received a new rfxtrx receiver for this purpose. However, nothing gets you quite so motivated to make progress as downed infrastructure....

All through the week I've been getting data collection working and finally getting it uploaded to Weather Underground, where I'm personal weather station KNYPOUGH7.

I've even started to get some local graphing working as well, like the following:

Temperature sensor graph

(outdoor temp, outdoor temp in cold frame, bedroom temp (sensor moved in the middle of the day for the spike), refrigerator temp, freezer temp)

The Raspberry Pi has made things interesting.... First, it's mobile, as I have it connected via wifi to the home network. This has been incredibly useful, as it turns out there is a sweet spot for seeing all my sensors consistently, which is only possible to get to if I don't have to worry about wired ethernet. The old solution had this sensor plugged directly into my home server, which meant drop outs on some of the sensors.

My old approach to data collection was rrdtool. As soon as I got a sensor reading I dumped it into an rrdtool database, which also made graphs. This had the advantage of being easy, and the disadvantage that rrdtool is a one way black hole for data. Once in, you can't ever get it out sanely. It's really designed to make operations centers look impressive and give admins the ability to eye trends, but makes working with that data not very useful. It does have the advantage of having a known fixed size, so you won't overrun your local storage.

In the new system I'm using mysql, on the pi. It's slow. Really slow. Often surprisingly slow. That slowness force one change in my thinking, which is to not use d3 to graph things client side, but instead generate static graphs with matplotlib on a cronjob, so user interaction won't be slow. It means the data might be a couple minutes behind, but for weather, that's fine.

The code... is currently terrible. However I've gone with the point of view that brute forcing working code right now is what I need to do to understand the patterns I want to build in this code. I spent too much time paralyzed on this project thinking through different ways to do it. So this will require some major refactoring and despecializing, already starting to happen, before it's of any value to anyone else. Once I get there, I'll have everything up on github as open source.

Related: First Temperature Graphs with RRD · New Temperature Sensors · Sniffing Oregon Scientific Weather Sensor Data

Year in Weather

http://c.brightcove.com/services/viewer/federated_f9?isVid=1&isUI=1

Dr Jeff Masters, who created Weather Underground, has a "year in" post on the weather of 2012. Which also tells the story in this remarkable video, showing a year in weather over the US in just 3 1/2 minutes (it slows down for some of the more dramatic events, which are kind of amazing). The Derecho that took out power in West Virgina, Virginia, and DC is by far the most amazing.

Related: Weather Channel on Android · Weather Station Progress · The Year of The Linux Desktop?

The Grand Conspiracy

Last night, among a generally jovial conversation around new finds in astronomy, I also was subjected to various out bursts of "electrical theory of mars" (i.e. Mars was carved by machines) and similar Grand Conspiracy ideas about how NASA had hid all this from us. It all came from one new club member, who's previous outbursts had been minor enough I hadn't yet realized he was a full time crank. The reaction from the table was mostly ignore and move on.

But it still amazes me that someone thinks it's far more plausible that tens of thousands of individuals are manipulating scientific information about Mars in a coordinated and consistent way. That they can manage to induct all new science students working on the data into their masonic clan. I guess it makes a good Dan Brown novel, but it maps really badly to reality.

And if the grand conspiracy was just at the kooky fringe, it would be something I could mostly chuckle at and move on. But grand conspiracies have become mainstream fodder. For instance, cable news generating a meme in conservative America that Climate Change is a hoax created by 10s of thousands of scientists to keep their jobs. Really? The next Dan Brown novel is going to be about grad students living 4 to an apartment, eating raman noodles, feeling so clever in their grand conspiracy?

I guess if you're primarily motivated by dollars, have a poor understanding of science in general, and never worked with science researchers before, it might make sense. First, project your basest motivations on others. Then sprinkle gracious ignorance about how science or economics work. Make sure to pass over the fact that if you had the mathematical chops to work out something as complicated as a climate model, and money was your motivator, you'd easily make 10 times as much being a Quant for the financial sector. They heavily recruit out of the physical sciences, many of my classmates from college went that route. But no, the grand conspiracy would rather believe the route to riches is applying for competitive NSF grants instead of credit default swaps and derivative trading.

So why do people believe in the Grand Conspiracy? Because it's comforting. It takes a complex world and makes it simple. Complex problems and motivations are now turned into mythical dragons that some mythical protagonist can go slay, making all right in the world.

The only problem with that: it isn't real. The moon landing wasn't faked, it took a generation of our best minds to get us there, and huge technological advances came out of it. Vacines don't cause autism, they've eliminated a vast number of debilitating diseases that you no longer have to worry about if you live in the west, and are now starting to eliminate certain kinds of cancer. Climate change is not a hoax, it's a real, hard problem, that we're going to need to figure out how to address as a society. Evolution is demonstrated science, we don't need a designer to create complex emergent behavior.

The world of facts and knowledge is one of spectacular beauty, complexity, and wonder, and doesn't need Grand Conspiracies to make it majestic and exciting.

Related: Mars Hoax · Ars Technica - The complicated history of simple scientific facts · Ars Technica: Who needs science? Lawmakers mull cell phone warnings