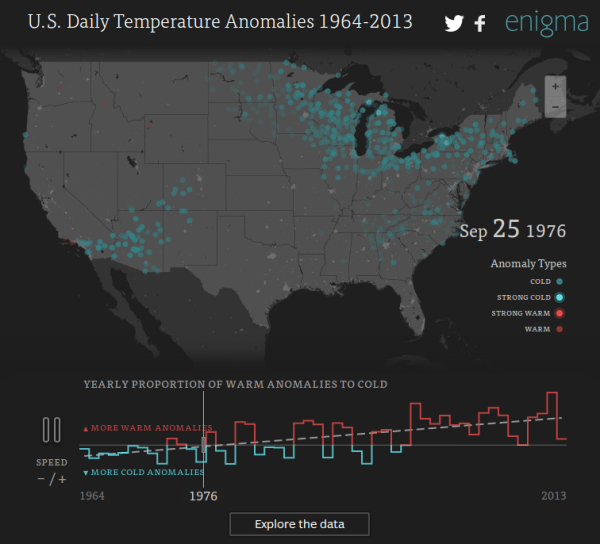
Very cool interactive graph visualizing temperature anomalies reported in the US from 1964 to current. The full site gives all the data they used and methodology for the analysis.
 Very cool interactive graph visualizing temperature anomalies reported in the US from 1964 to current. The full site gives all the data they used and methodology for the analysis.