"The best time to plant a tree was 20 years ago. The second best time is now."
Over the last year we've done a lot to our house to make it much less energy intensive, bought an electric car, and got involved in Citizens' Climate Lobby. The research for all of that created a big pile of links for me, which I've tried to summarize here, to really show how many different ways you can make an impact.
This list is customized for New York, because that's where I live, and where I've done all my research. It would be great to see other folks build local guides for their areas as well, and I'd love to link to them.
Where Energy is Used
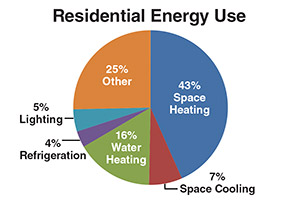
How do we use energy in the US? Because we measure electricity in kWh, gasoline / fuel oil in gallons, natural gas in cubic feet, sizing them all up and comparing them is hard. And we don't think about them as a single energy system. At a national level our energy is used by this breakdown:
- Buildings - 40%
- Residential - 20%
- Commercial - 20%
- Transportation - 28%
- Cars, Light Trucks, Motorcycles - 16.2%
- Other Trucks - 6.4%
- Planes - 2.2%
- Industry - 32%
- Petroleum Refining - 10%
- Chemical Production - 8.6%
- Paper Production - 3.5%
- Metals Production - 3%
The bits of this that always surprise me is that buildings are our key use of energy. Buildings are long term infrastructure. Our house was built in 1960, there are plenty of houses in our area build in 1900. Improving existing buildings is critical to making our infrastructure more efficient. Every improvement we've made over the last couple of years will live on beyond us in this home.
The other thing that sticks out is that we use 10% of our energy budget in the US refining petroleum. Much of that to be burned in other parts of the system. Every time we prevent a gallon of gas from burning, we don't only save it's emissions, but the emissions that happened when it was refined.
Homes
 Average Home Energy use in NY State
Get a home energy inspection
In NY, the NY State Energy Research and Development Agency has many programs to increase energy efficiency. One of the programs is subsidized home energy audits to give you a targeted plan about what the biggest impacts for saving energy in your home will be.
Air sealing and Attic Insulation
Our home was built in 1960, and insulated to the standard at the time (which was not much). A year ago we went forward on our energy audit recommendations and got our attic air sealed, and 8" of cellulose insulation put on top. The results were dramatic. Heating dropped about 15%, my home office (which is the far end of the HVAC), no longer needed a space heater, and summer cooling was also dramatically reduced.
Get your energy inspection first, but realize that proper insulation in your home will dramatically, and immediately change the comfort level, and your energy use.
Replace your Oil Furnace with Geothermal
About 50% of homes in NY State heat with Fuel Oil. It is one of the dirtiest way to heat your home.
If you live in the Hudson Valley or Albany regions, Dandelion is a new geothermal company offering package deals to replace your existing oil system with a ground source heat pump. They put a well or two in your front yard, put a sealed tube down it, then use the 50 degree earth and a compressor to heat your home. Heat pumps get about 4 units of heat for every unit of electricity they consume. Ours has been in for about a month, and so far we're in love. So much quieter, no whiffs of oil smoke, and much more even distribution of heat in the house (it runs the fan slower and longer).
When I did the math, this was the single biggest climate impact we could make. This takes 700 gallons of fuel oil off the table. In comparison, we used about 500 gallons of gasoline in an average year between our cars.
Replace your Oil Furnace with... anything else
Seriously, Fuel Oil is terrible for the environment. While Natural Gas and Propane are still fossil fuels, they emit a lot less both in creating them, and when they burn. If you can't go the full hog to something like a heat pump, changing from Oil to NG or Propane will reduce your emissions on heating to about 1/2 of what they were before.
Lighting
If you've not yet replaced all your lighting in your house with LEDs, do that now. They only use about 20% of the electricity of incandescent bulbs, are more efficient than even fluorescent, and last an incredibly long time (25 year lifespans are common).
If you are a Central Hudson customer you can get 60W replacement bulbs for $1 each. Just do it. While lighting use is overall a pretty low part of your energy budget, it is also very actionable if you haven't done the conversion to LEDs yet. And, LED lights fit in christmas stockings.
Electricity
The path to decarbonizing the economy is to electrify everything, while simultaneously making the electric grid less carbon intensive.
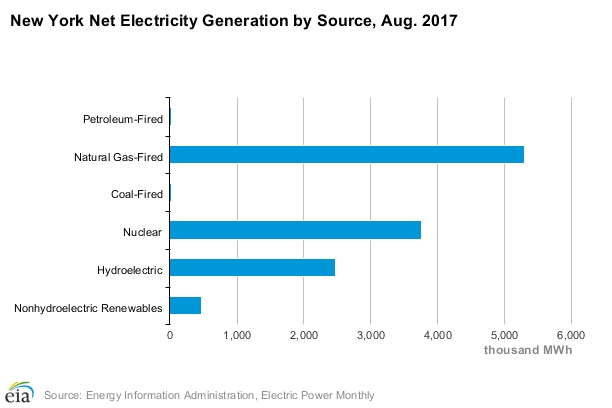 NY State's energy production is relatively low carbon, but if we are going to fully decarbonize we do need to reduce natural gas consumed for electricity as much as possible.
Choose a Green ESCO
NY State allows you to choose your energy producer (energy services company, or ESCO). There are a number of companies that provide you with energy from wind farms that they are building regionally. This typically mean a small rise in your energy costs, but that comes with supporting the build out of new renewables.
Two good options in our area are:
Community Solar
NY State has new rules in place that allow for Community Solar in our area. These are small scale (2 Mega Watt or less) facilities that you can sign up and get your power from solar even if you can't put solar panels on your roof (you have bad site, or are a renter).
Solarize Hudson Valley has sign up information for folks in the area. If you are in the Central Hudson power generation region, Nexamp is building a facility in Wappingers Falls. We've signed up, and starting in May of 2018, will be getting our power from solar.
Carbon Offsets
If there is nothing on the list that works for you, but you still want to have an impact on reducing your carbon footprint, consider some kind of carbon offset. Carbon offset projects work to capture carbon, or reduce emissions from something like a landfill. We all share one atmosphere, so any way you reduce emissions helps.
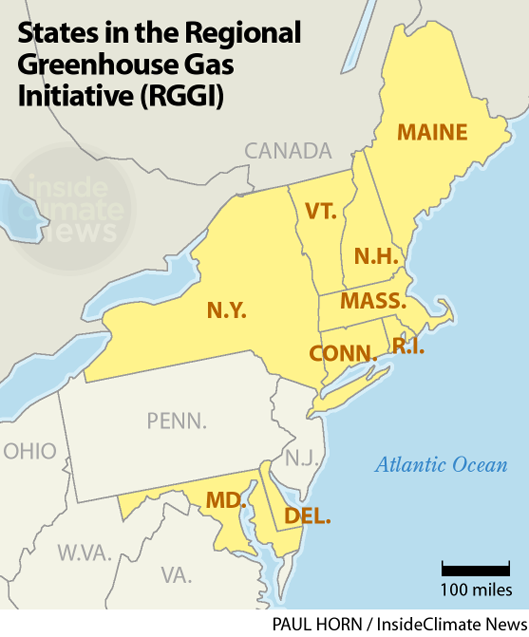
The carbon offset market is a wildly confusing place as an individual. As a NY (or North East) resident, the Carbon Reduction Certificates from the Adirondack Counsil is great. Each certificate is used to buy 1 ton of CO2 off the Regional Greenhouse Gas Initiative annual carbon auction (a carbon trading system for power companies that 9 states have agreed to, and NJ and VA might be joining soon). The price for a ton of carbon on the RGGI is still pretty low, so left over proceeds go to their micro grants program which support local energy efficiency and emissions reduction.
Get Engaged
Right now, you need to do something extra, or out of the ordinary to have an impact on climate change. Citizens' Climate Lobby is a political action group looking to change that, by pricing carbon in the economy. A real price on carbon would make doing the efficient thing, also be doing the cheaper thing, which would make it the default choice in most situations.
We've got a local chapter that meets in Beacon, NY once a month, and so if you want to flex your political muscles, as well as your economic ones, sign up and join us.
It all maters
Every action you make matters. And the exciting fact is that there are so many things you can do now to have an impact (including many things not on this list). So take a minute this holiday season and think about how you can take a little bit of coal out of your own Christmas season.
Alsup insisted that this tutorial was a purely educational opportunity, and his enjoyment of the session was obvious. (For the special occasion, he wore his “science tie” under his robes, printed with a graphic of the Solar System.) But the hearing could have impacts beyond the judge’s personal edification, Wentz says. “It’s a matter of public record, so you certainly could refer to it in a court of public opinion, or the court of law in the future,” she says. Now, Wentz says, there’s a formal declaration in the public record from a Chevron lawyer, stating once and for all: “It is extremely likely that human influence has been the dominant cause of the observed warming since the mid-20th century.”
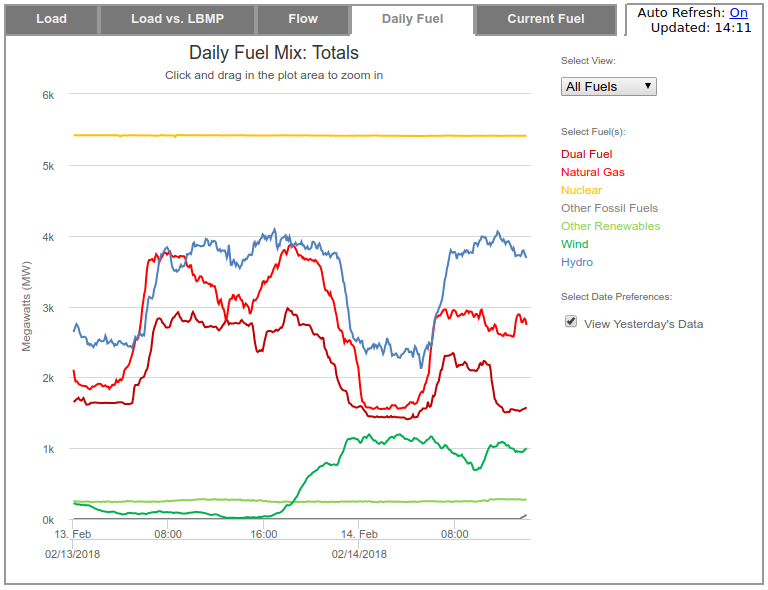
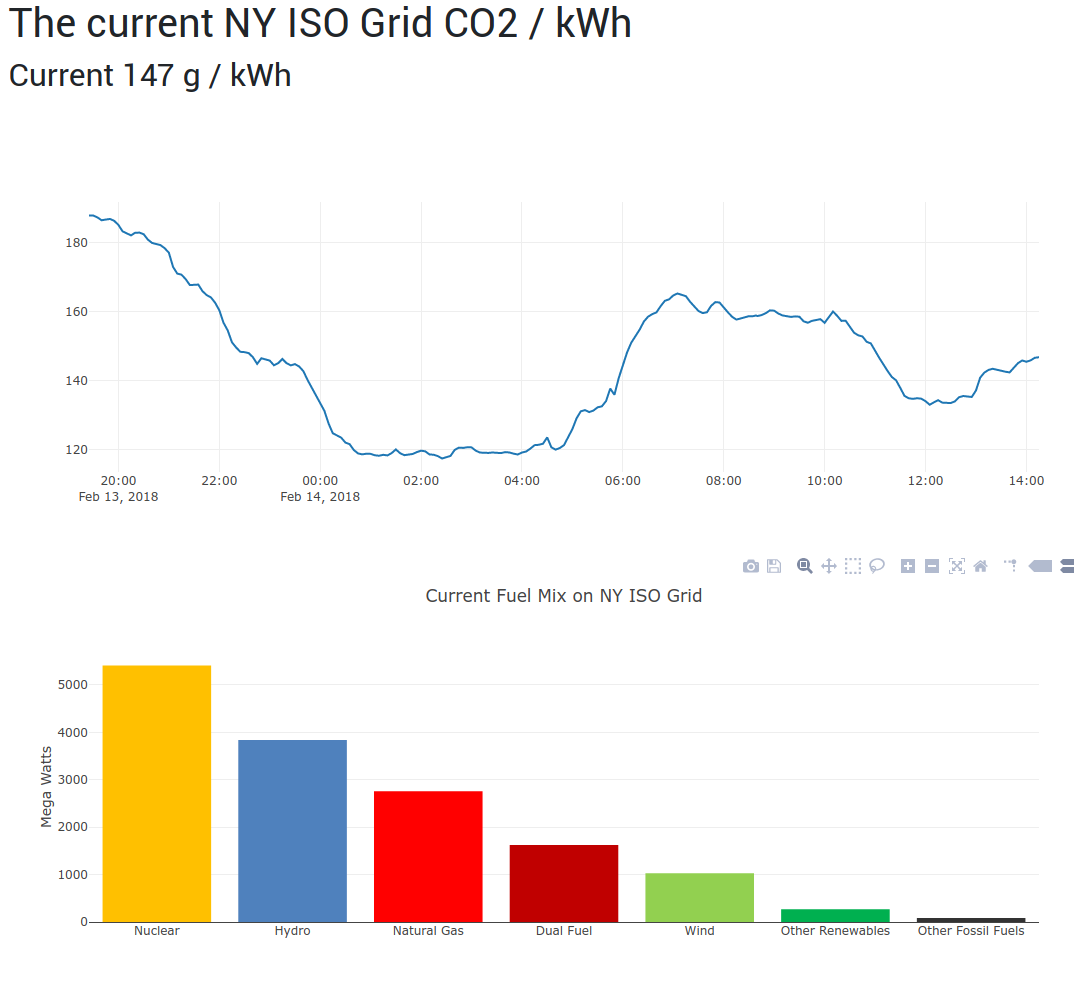 That's the current instantaneous fuel mix, as well as the estimated CO2 per kWh being emitted. That's done through a set of simplifying assumptions by looking at 2016 historic data (
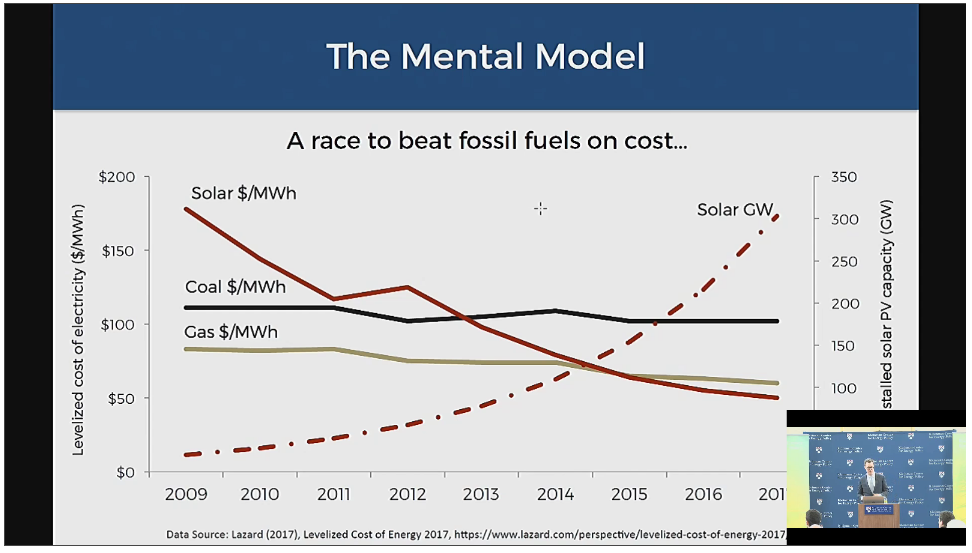 He starts with the common and simple refrain we all have, which is that research investments in solar have driven down the cost below that of fossil fuels, that cross over point has happened, and renewables will just take off and take over.
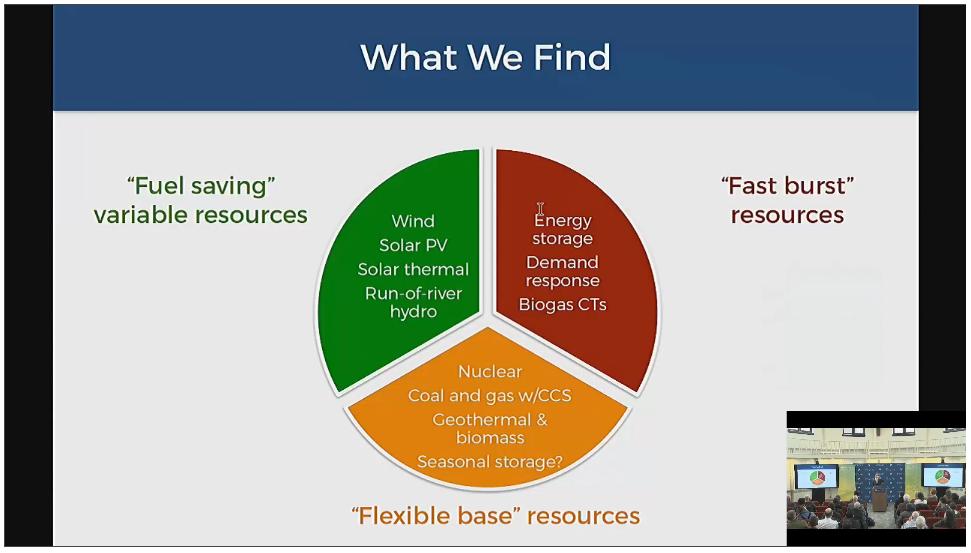 Jenkins bundles these into 3 categories. Renewables are great at Fuel savings, providing us a way not to burn some fuel. We also need a certain amount of fast burst on the grid, today this is done with Natural Gas Peaker plants, but demand hydro and energy storage fit that bill as well. In both of these categories we are making good progress on new technologies.
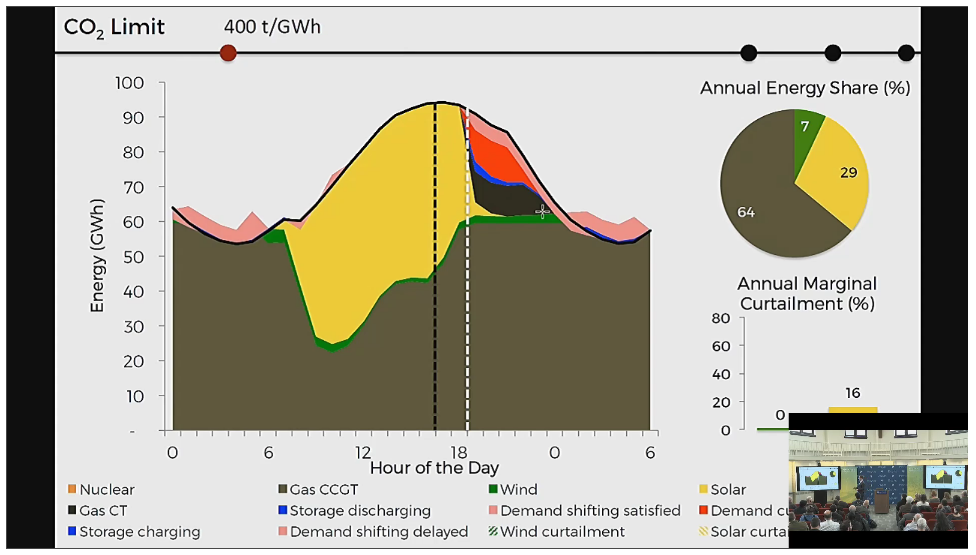
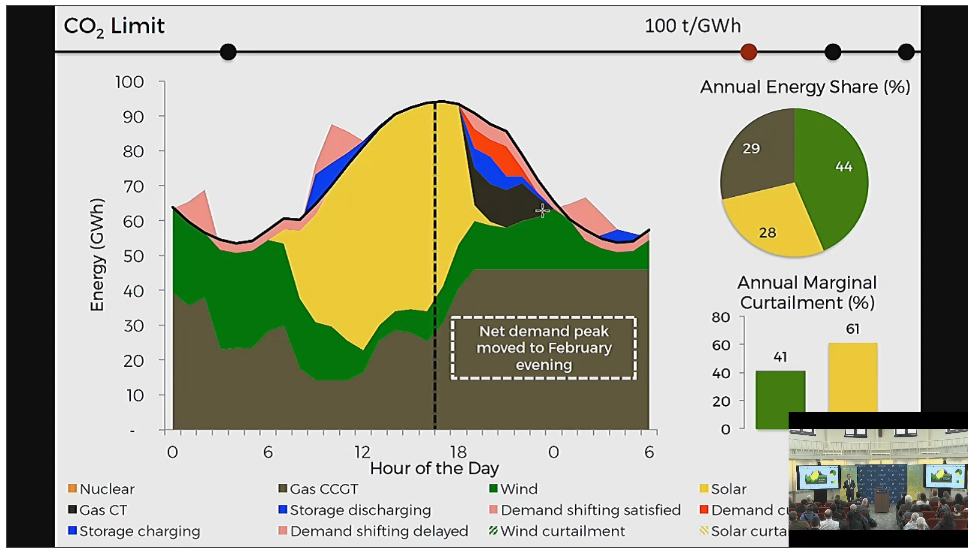 Crank down the emissions limit and you get more solar / wind, but you get a lot of curtailment. This is a 70% renewable grid. It's also got a ton of over build to deal with the curtailment.
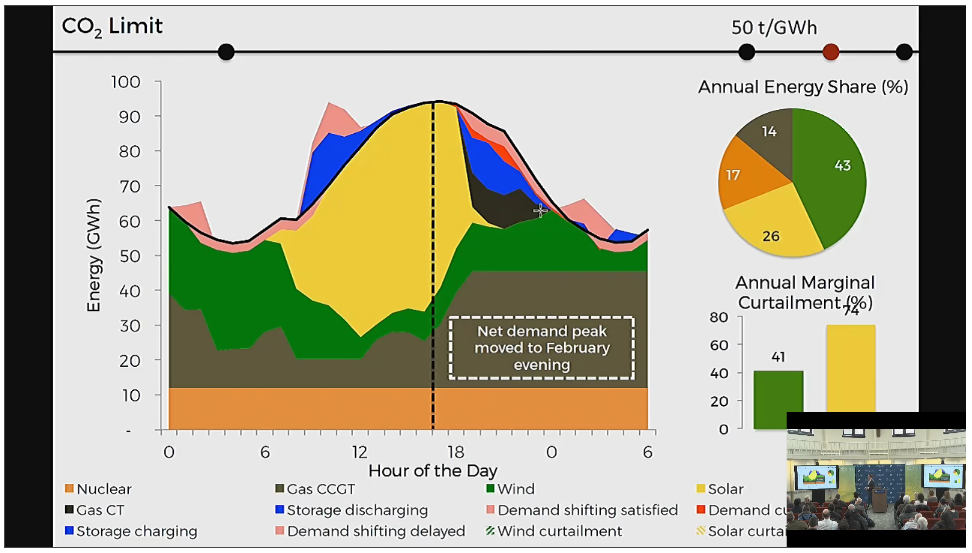
 Which is the share of renewables goes down. They are used more efficiently, there is less curtailment. These are "cost optimal" projections with emissions targets fixed. They represent the cheapest way to get to a goal.
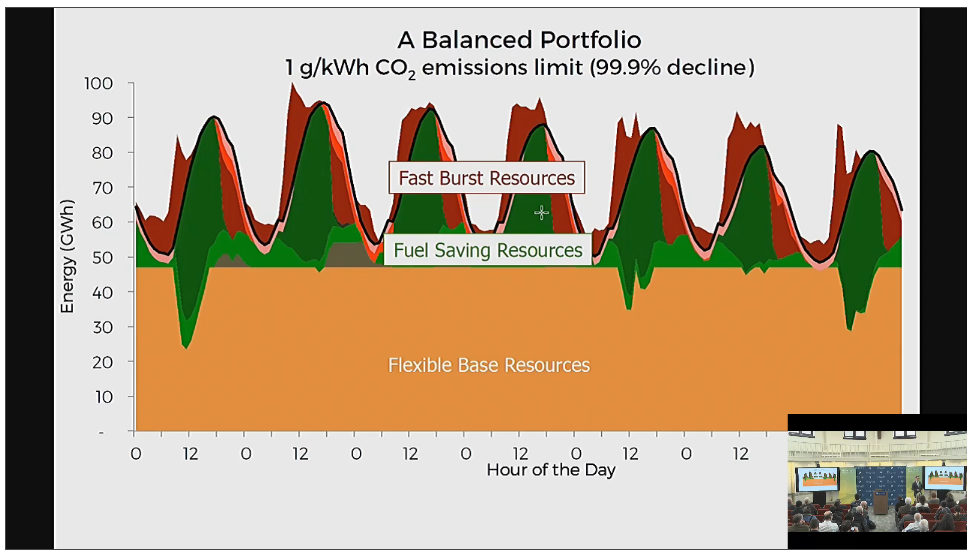
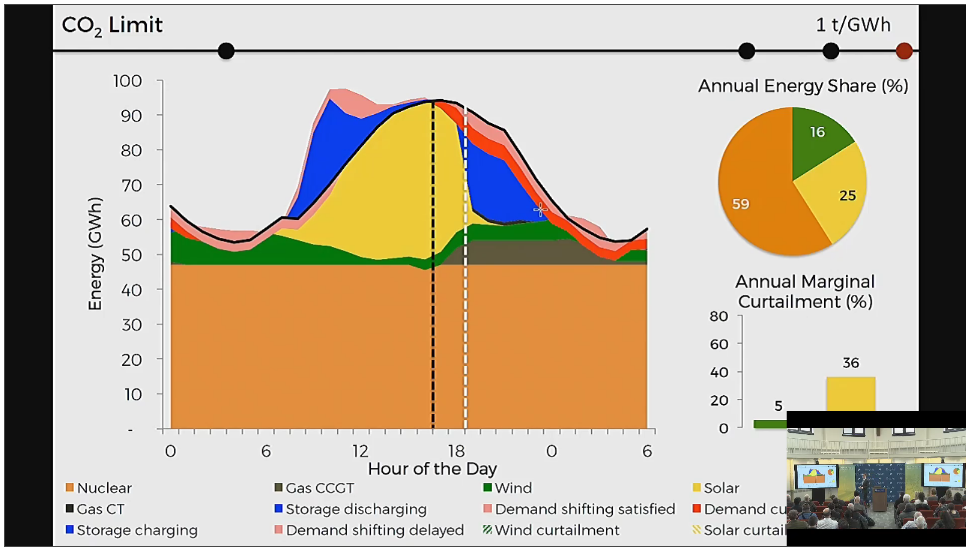
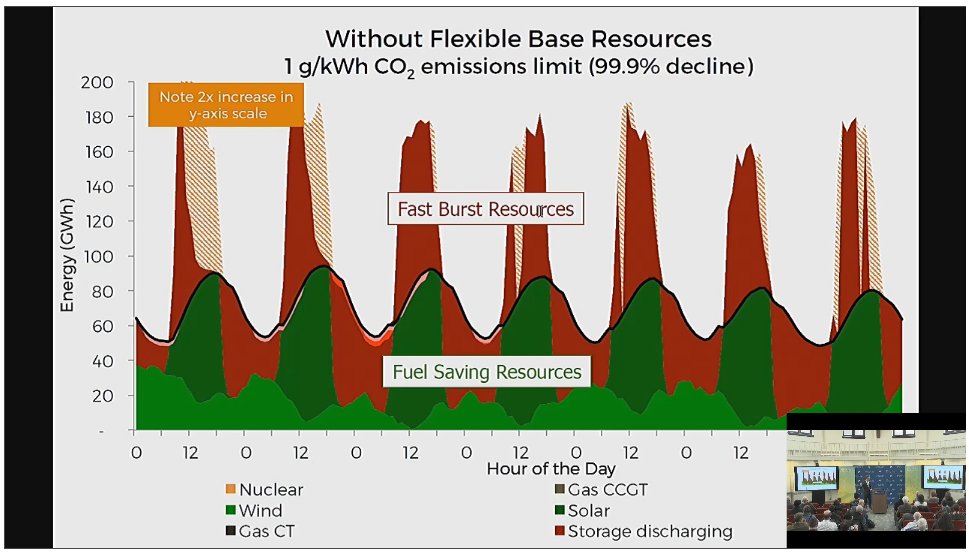 When you pull out the flexible base you end up with a requirement for a massive overbuild on solar to charge sources during the day. Much of the time you are dumping that energy because there is no place for it to go. You also require storage at a scale that we don't really know how to do.
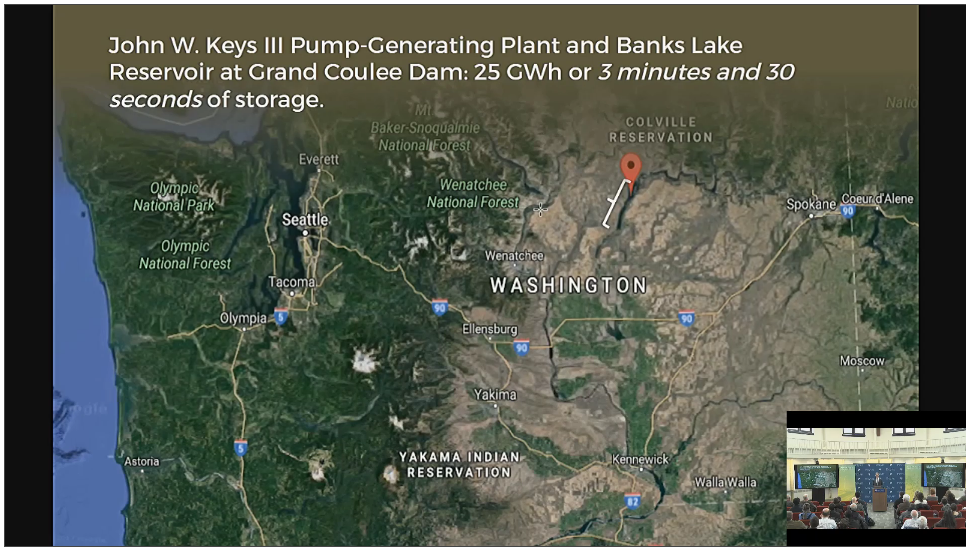
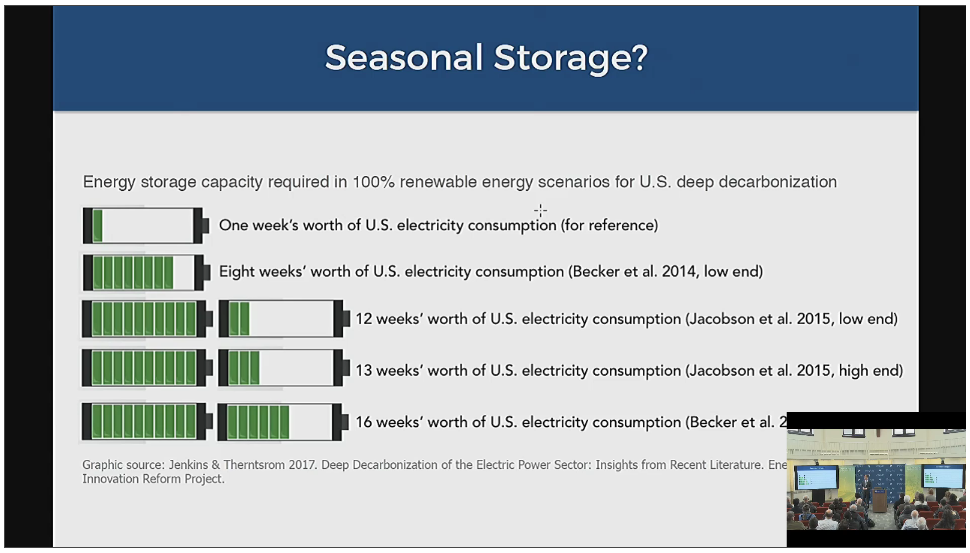 What does that look like? Pumped hydro is currently the largest capacity, and most efficient way to store energy. Basically you pump water behind a dam when you have extra / cheap energy, then you release it back through the hydro facility when you need it. It's really straight forward tech, and we have some on our grid already. But scale matters.
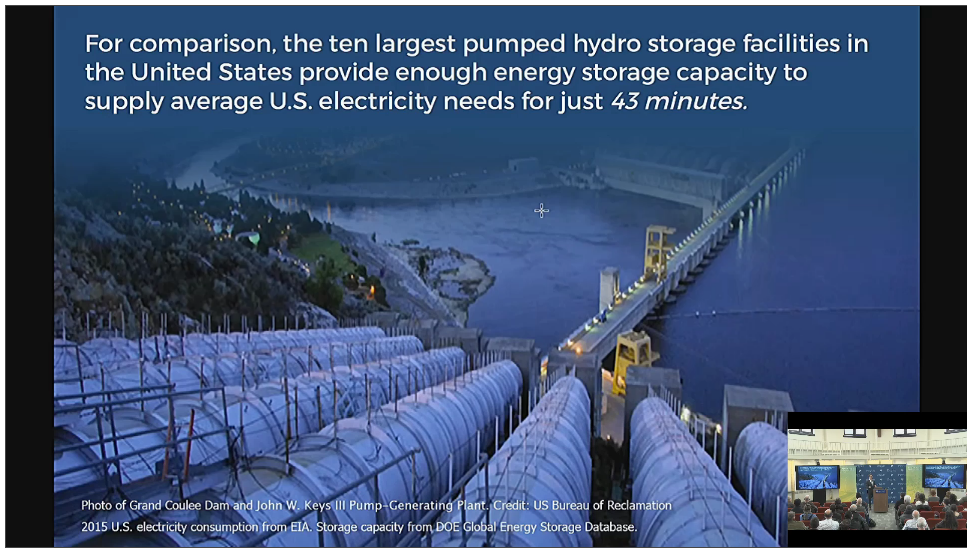 The top 10 pumped hydro facilities combined provide us 43 minutes of grid power.
One of the larger facilities is in Washington state it is a reservoir 27 miles long, you can see it from space. It provides 3 1/2 minutes grid average power demand.
The top 10 pumped hydro facilities combined provide us 43 minutes of grid power.
One of the larger facilities is in Washington state it is a reservoir 27 miles long, you can see it from space. It provides 3 1/2 minutes grid average power demand.
 Pumped hydro storage is great, where the geography supports it. But the number of those places is small, and it's hard to see their build out increasing dramatically over time.
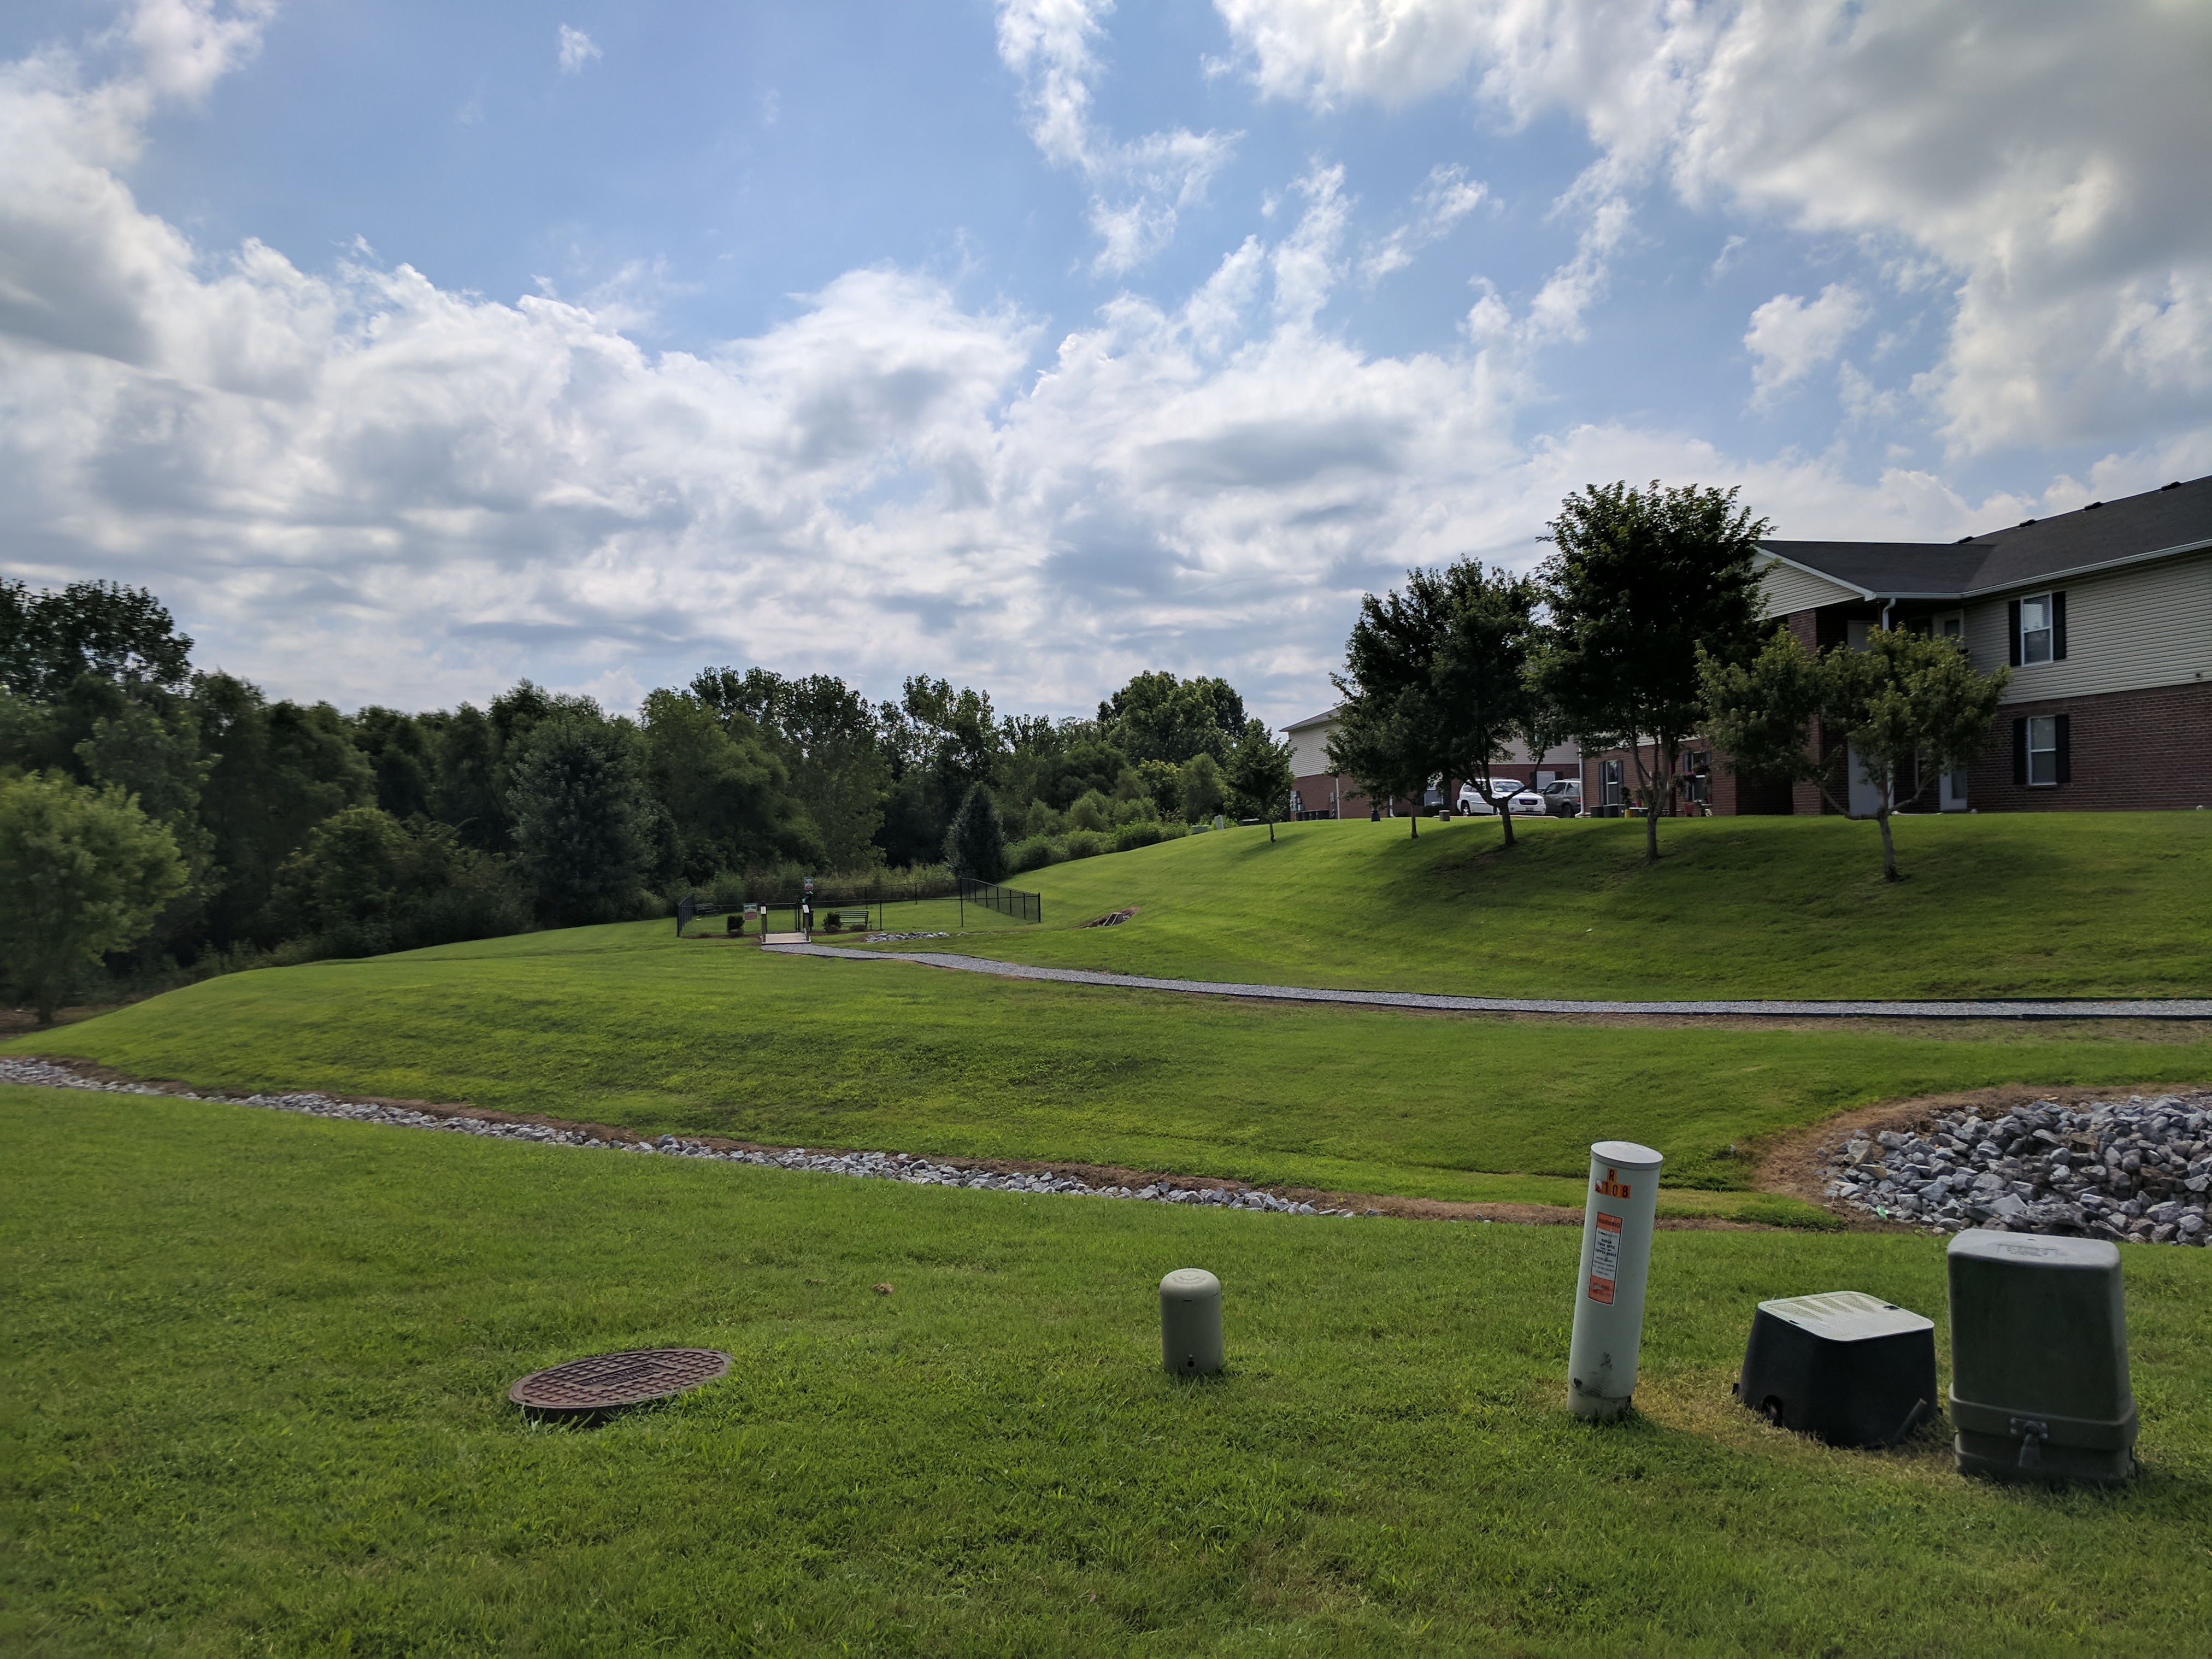 Our setup area for the eclipse
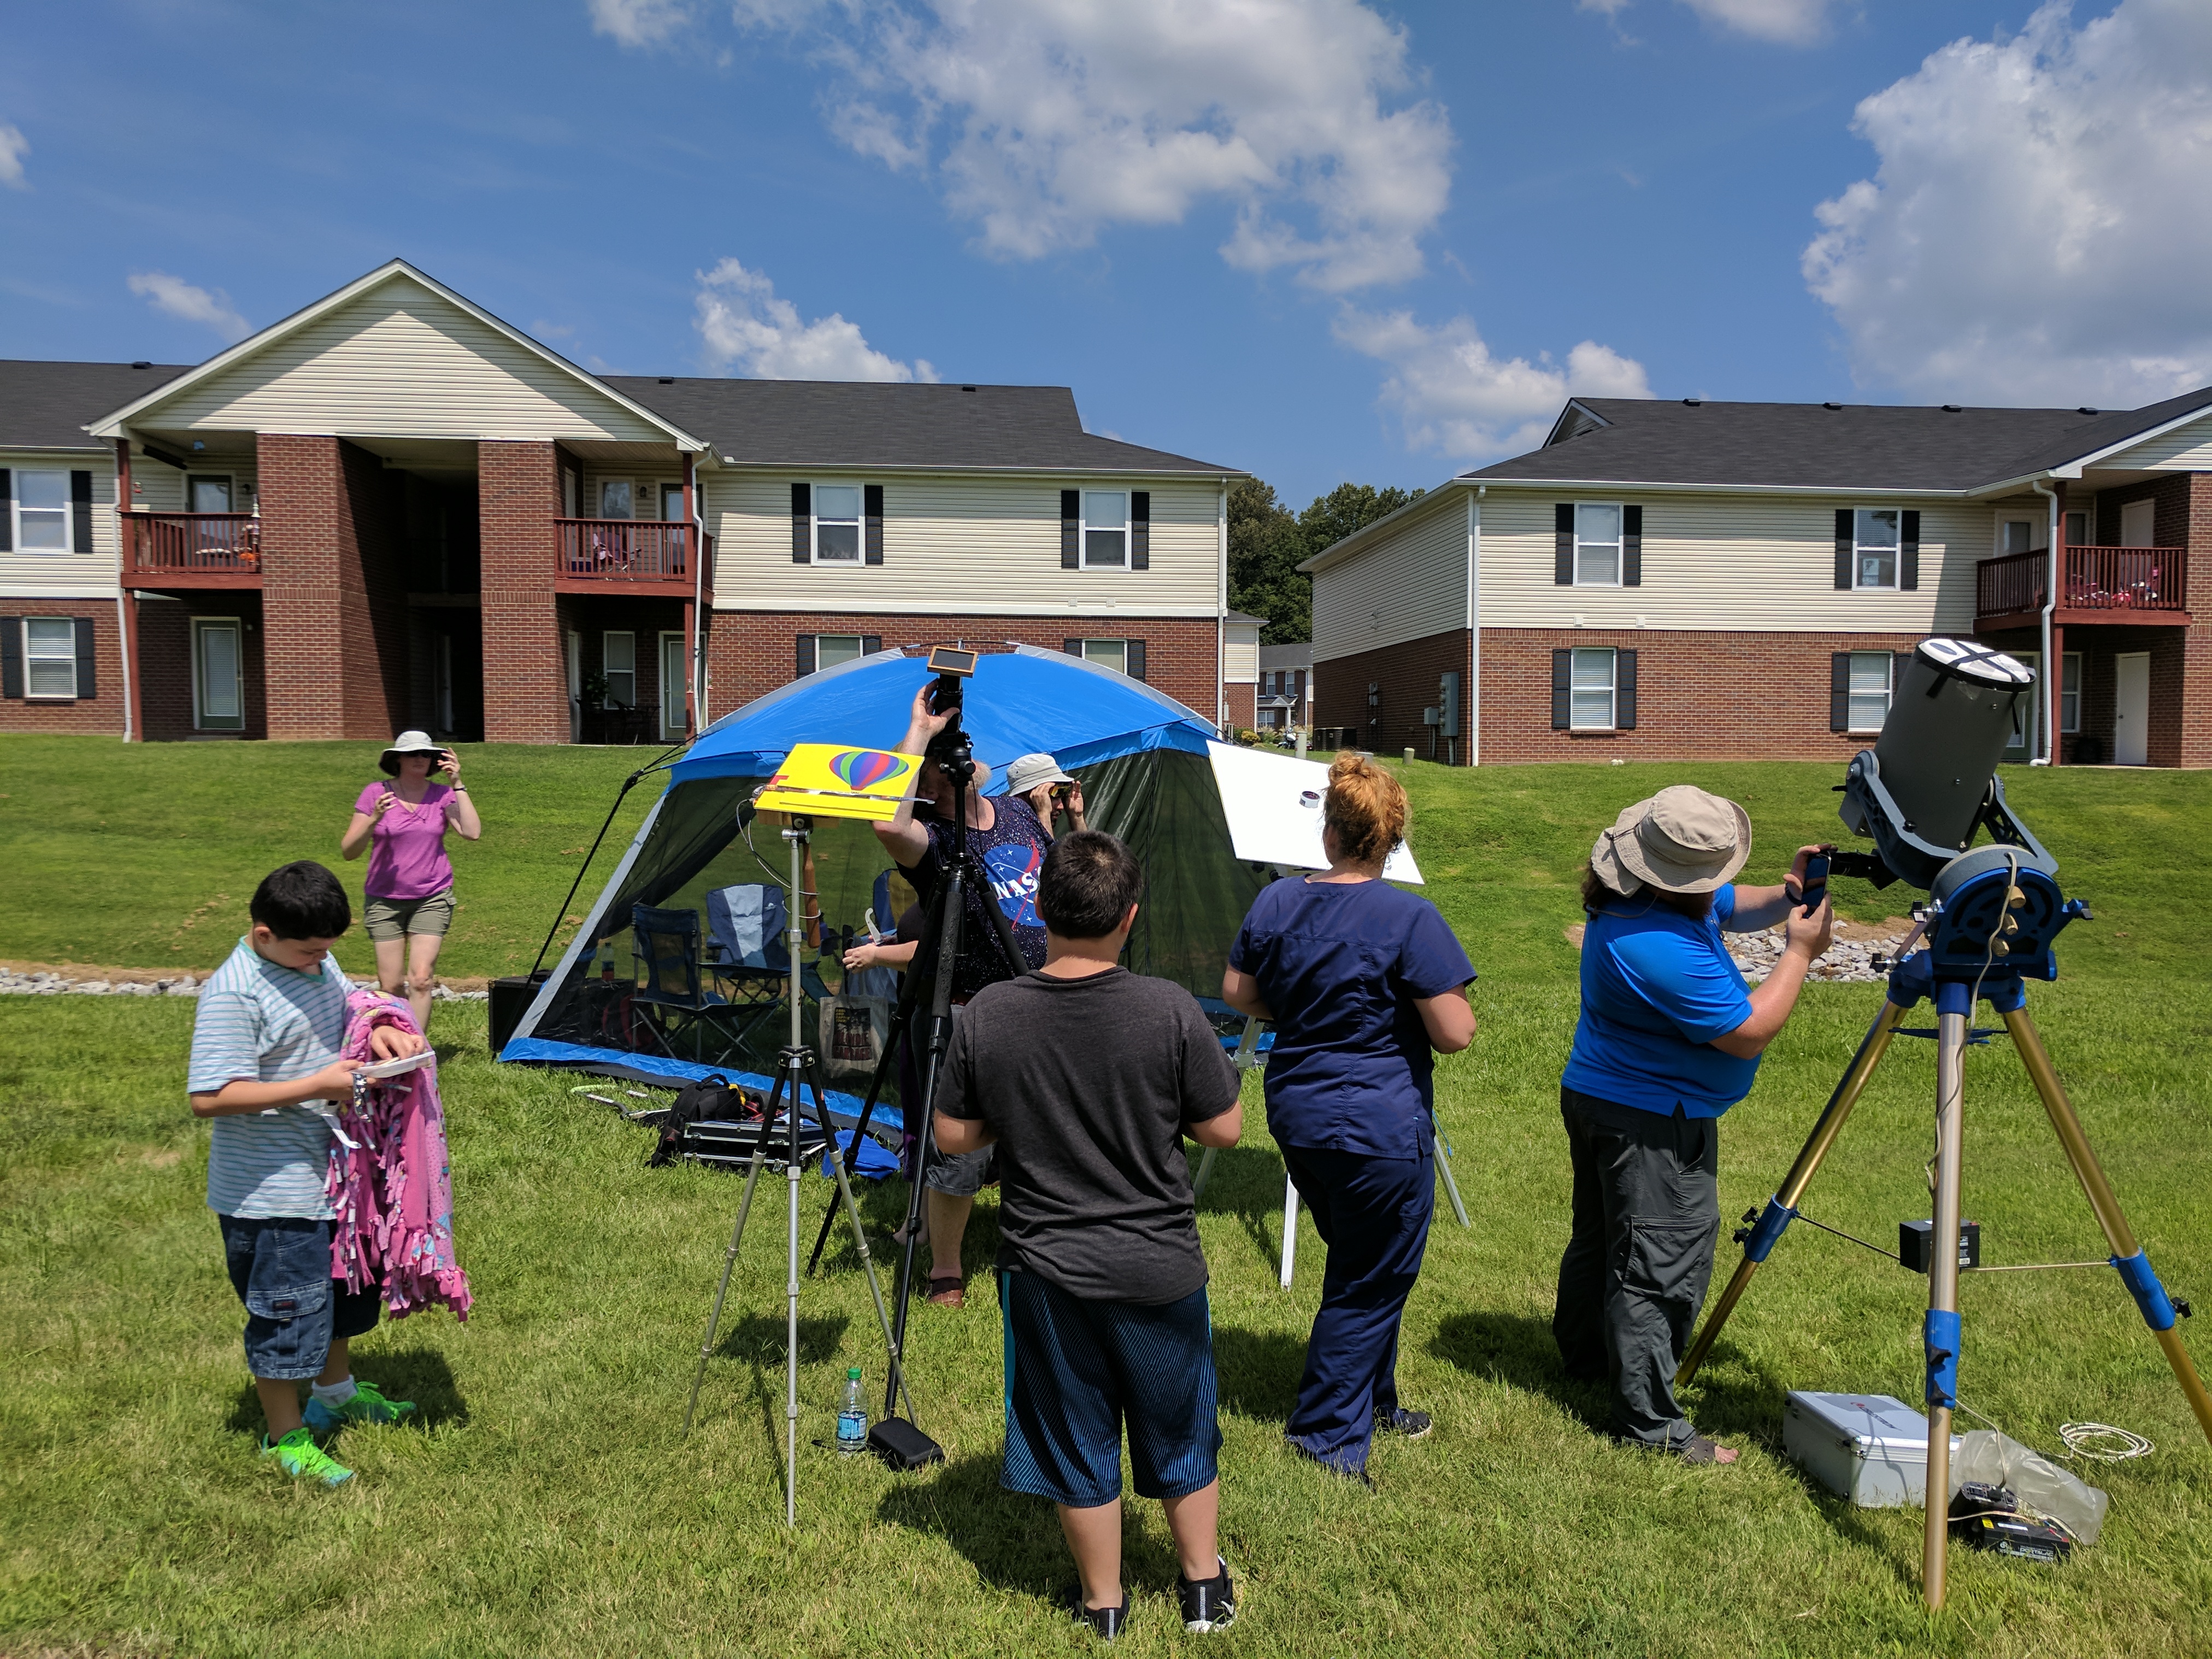 All set up, shade tent, telescopes
First contact. The moment when you stare through those eclipse glasses and say: "wait, is that side just a little flat now? Maybe I'm imagining it. No, I really think it is. Yeah, that must be real." As the eclipse grows, your brain does this funny thing and enhances the boundary. The silhouette of the Sun seems to glow brighter than the Sun itself.
All set up, shade tent, telescopes
First contact. The moment when you stare through those eclipse glasses and say: "wait, is that side just a little flat now? Maybe I'm imagining it. No, I really think it is. Yeah, that must be real." As the eclipse grows, your brain does this funny thing and enhances the boundary. The silhouette of the Sun seems to glow brighter than the Sun itself.
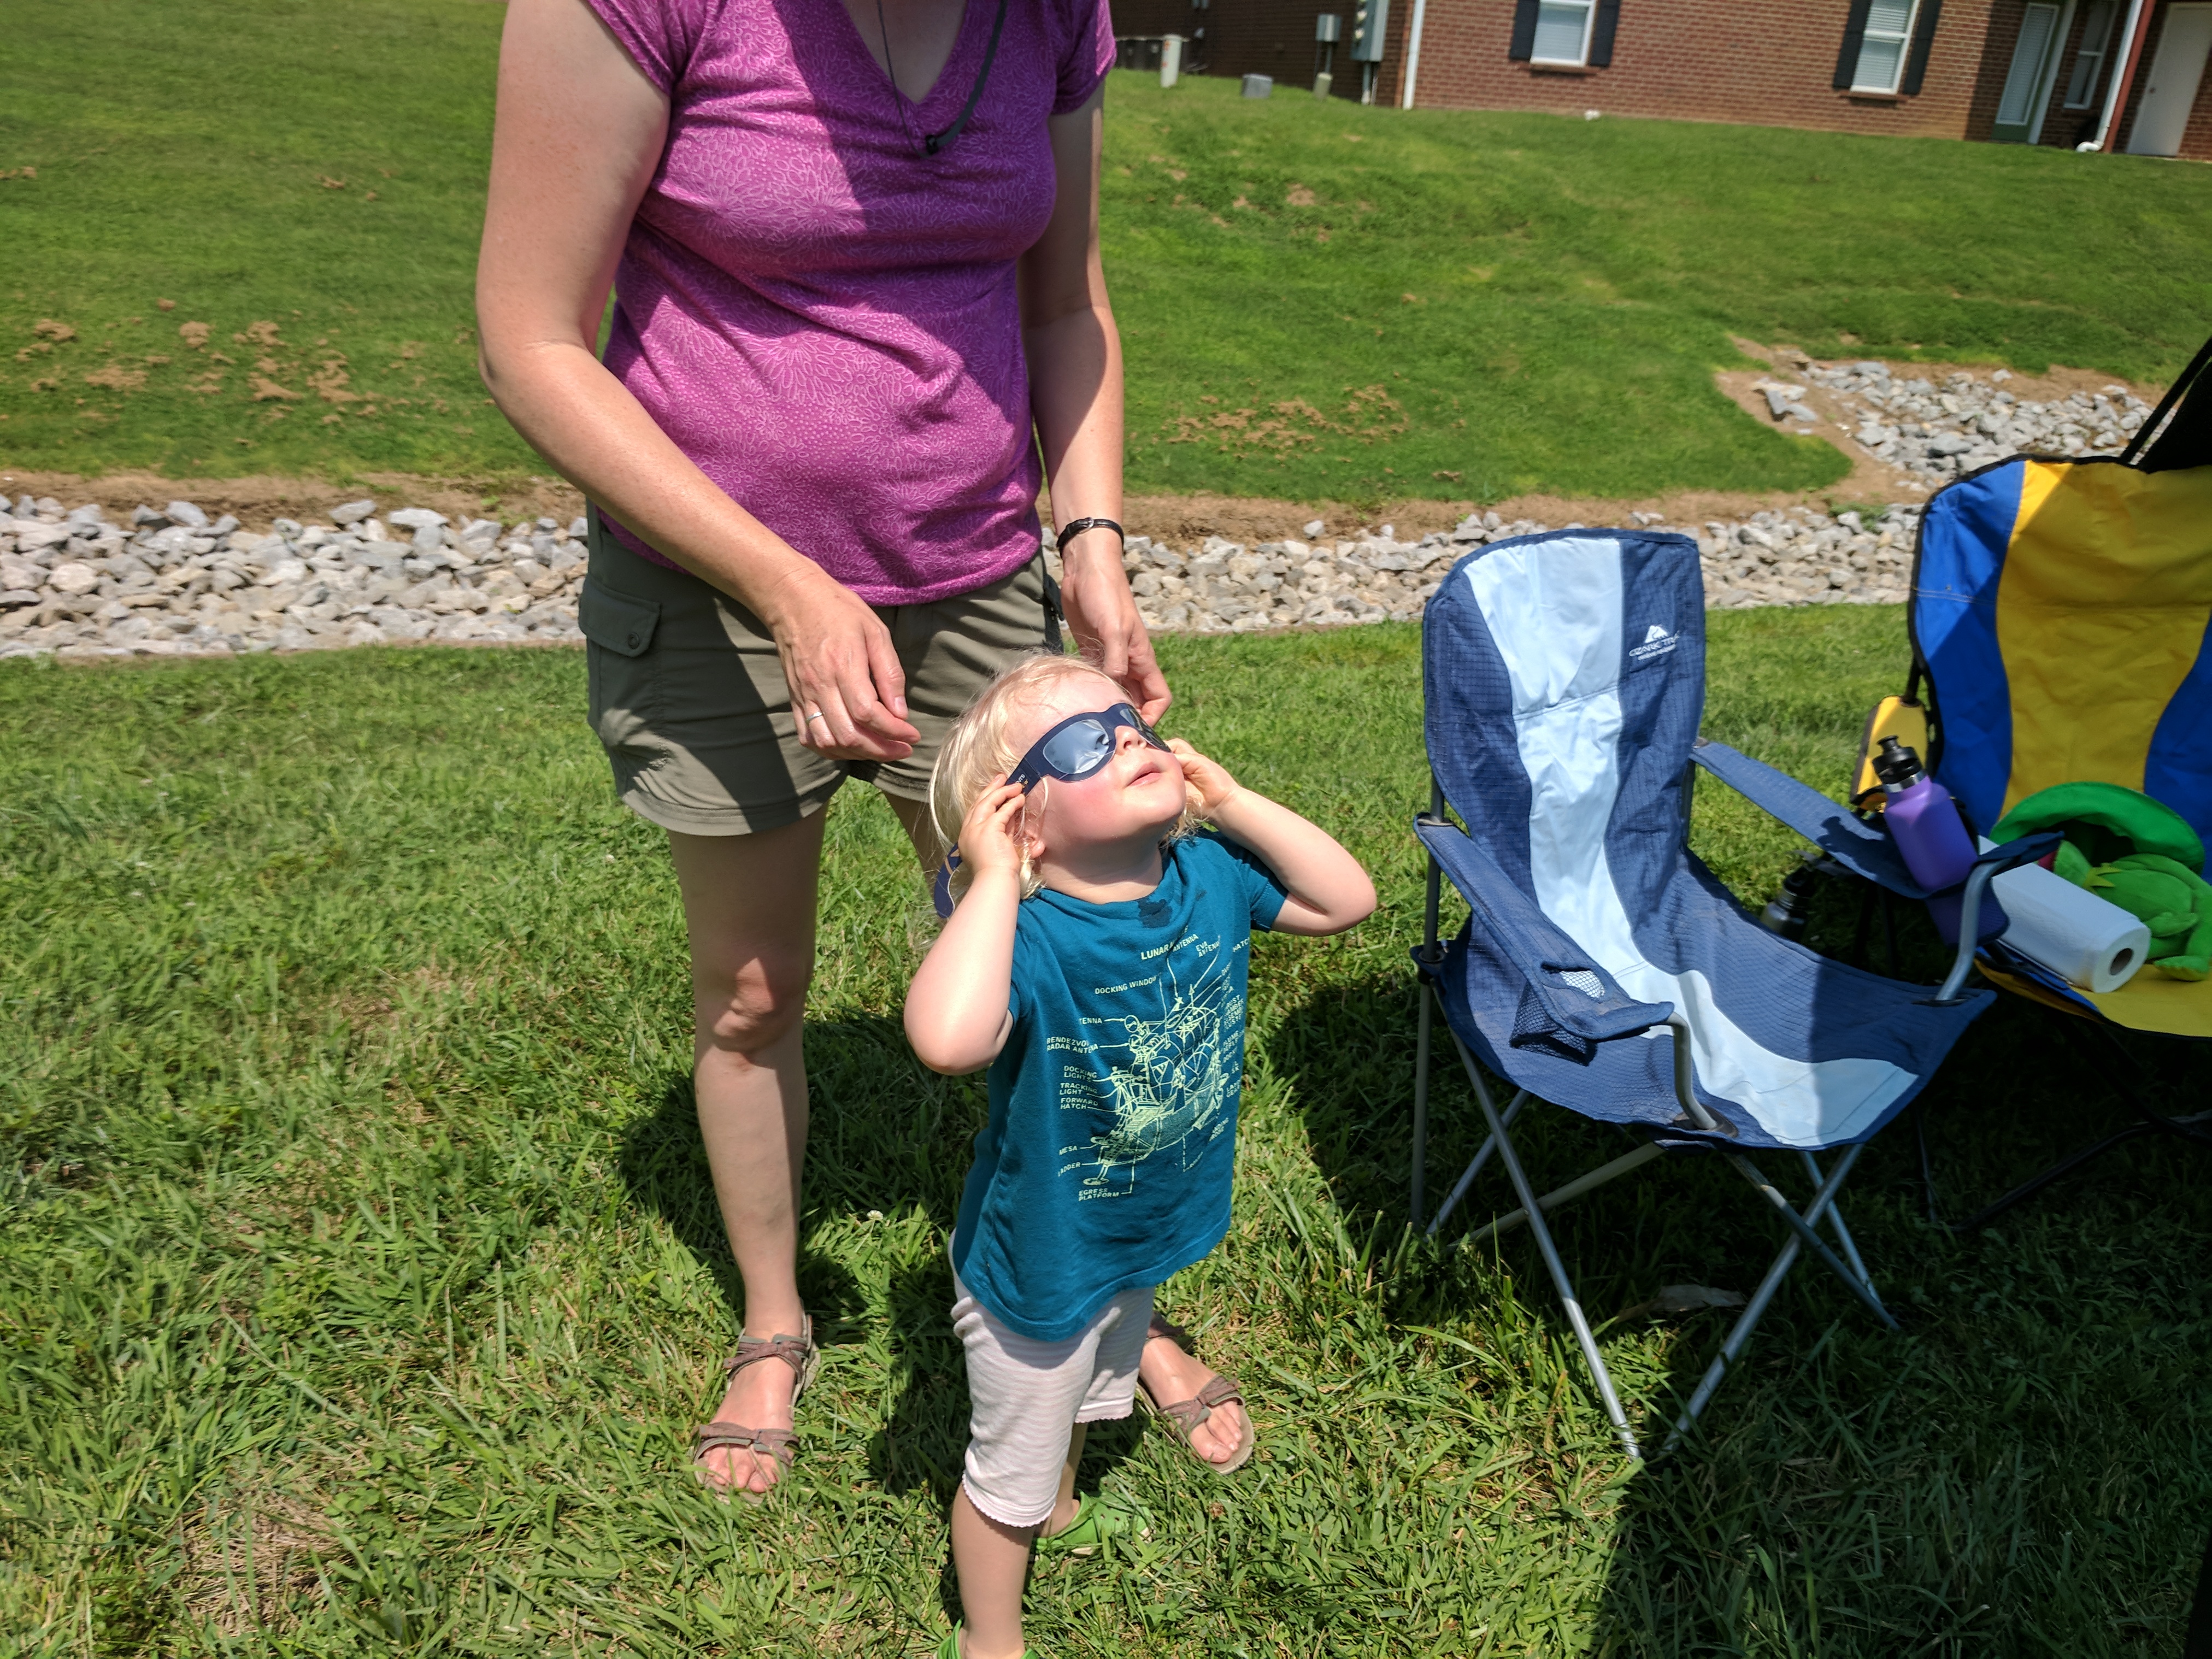 Eclipse glasses on!
After about 20 minutes, and our pacman shape ever growing, I realized we're never going to break for food (the original plan), we should bring it back down here. So I headed back upstairs with Nick, prepared a bit of our picnic food that we'd gotten the night before, and headed back provisions in hand.
Eclipse glasses on!
After about 20 minutes, and our pacman shape ever growing, I realized we're never going to break for food (the original plan), we should bring it back down here. So I headed back upstairs with Nick, prepared a bit of our picnic food that we'd gotten the night before, and headed back provisions in hand.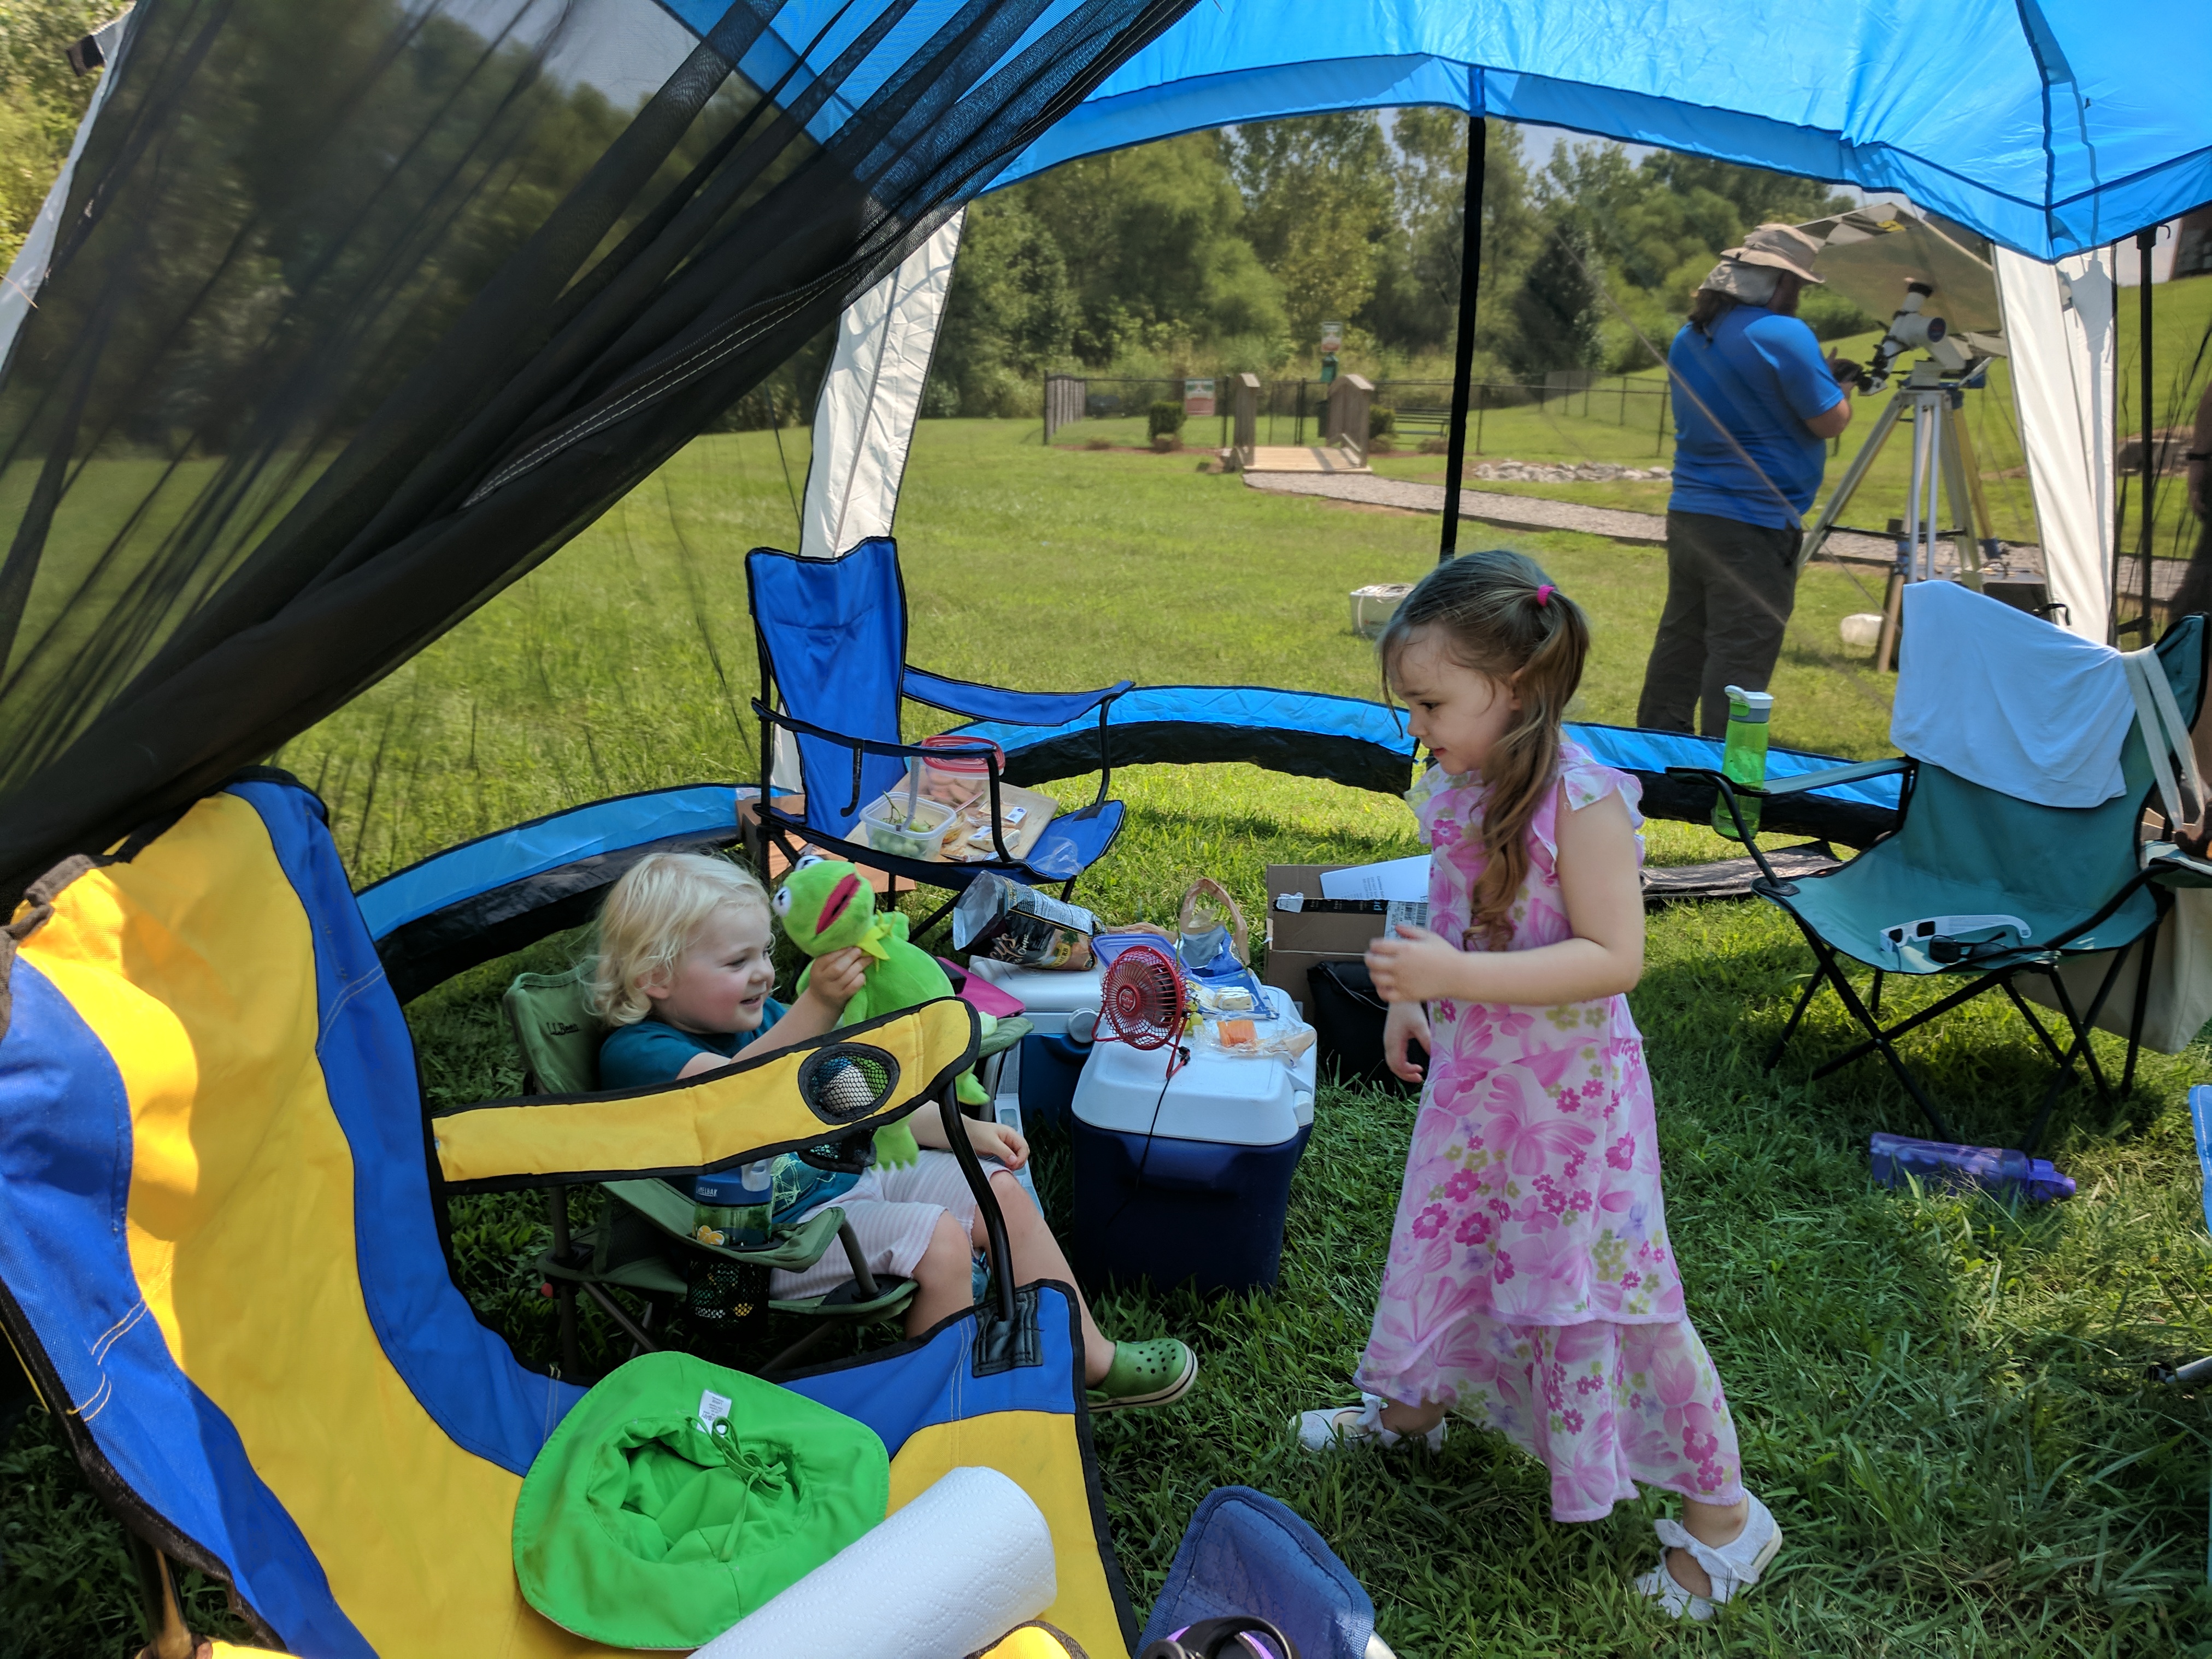 Shade tent, and making new friends
With our little camp setup, folks from the complex started stopping by. Including a number of kids. Jack's a pro at the sidewalk astronomy outreach, we introduced people to the scopes, what they were looking at, and kept them pointed and in focus. One of the kids came back out with popsicles for everyone as a thank you for letting everyone see through those scopes.
Shade tent, and making new friends
With our little camp setup, folks from the complex started stopping by. Including a number of kids. Jack's a pro at the sidewalk astronomy outreach, we introduced people to the scopes, what they were looking at, and kept them pointed and in focus. One of the kids came back out with popsicles for everyone as a thank you for letting everyone see through those scopes.
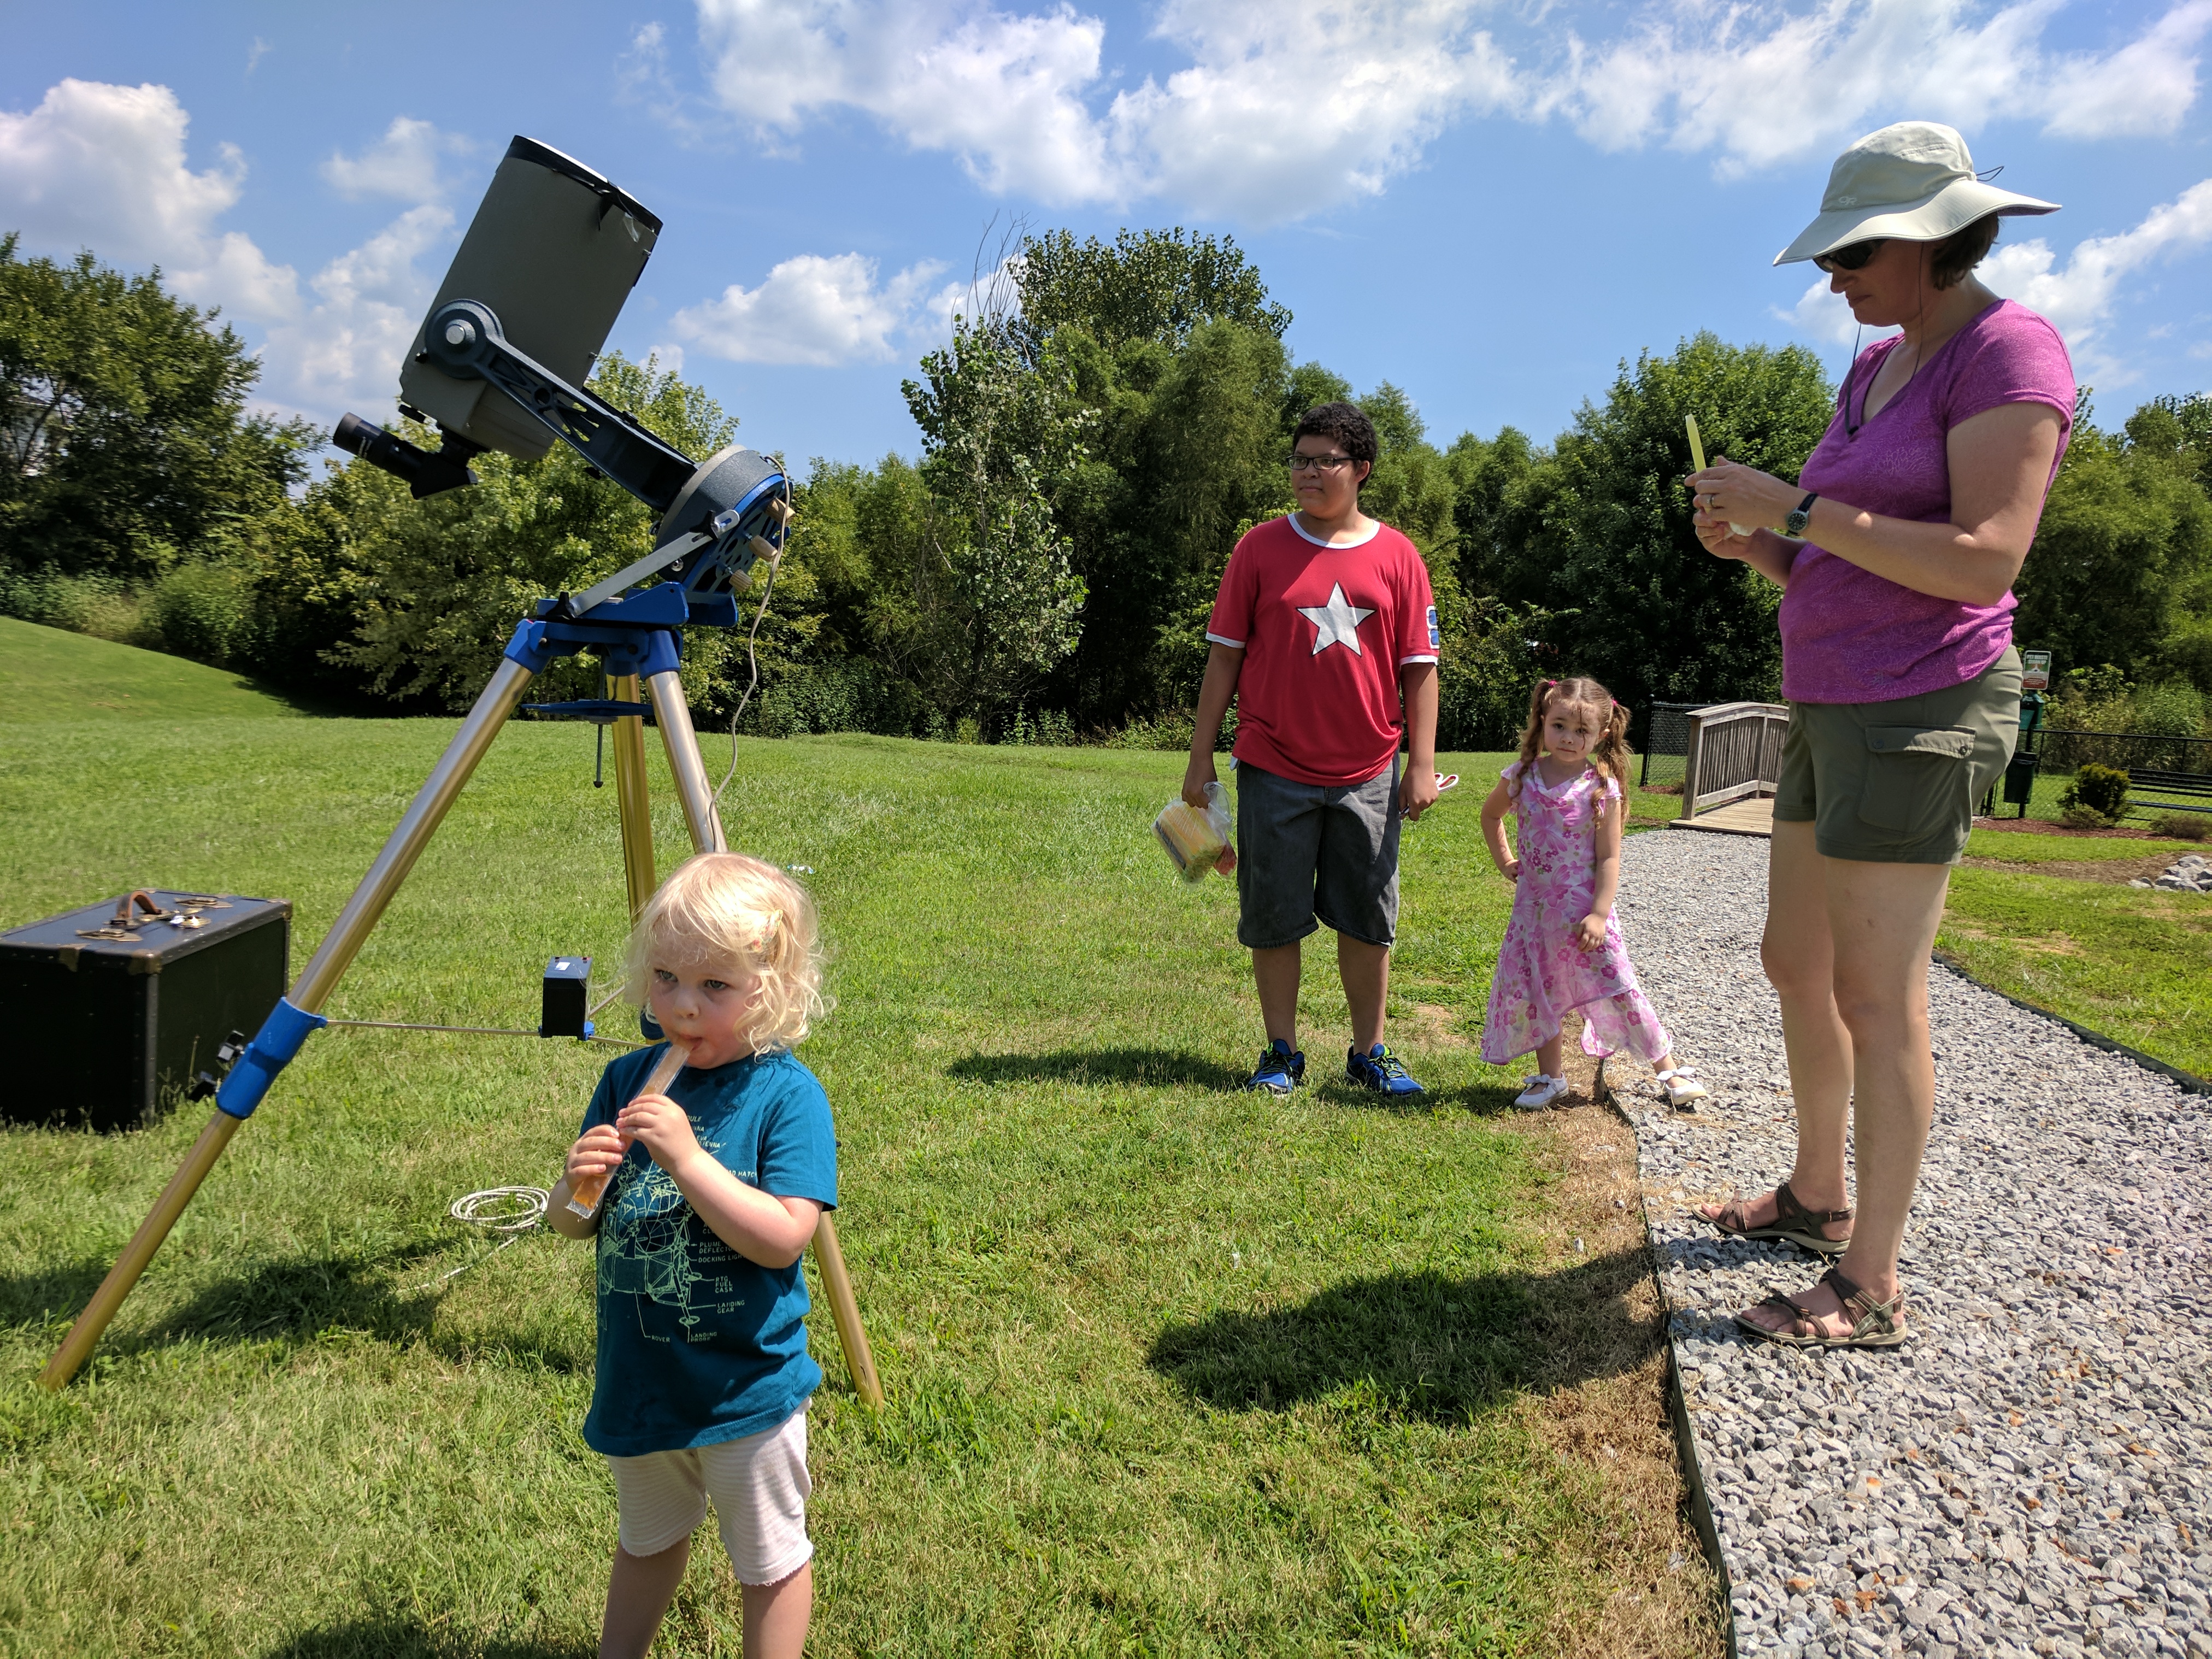 Popsicle break
It was never going to get cold in Tennessee, but once we got past 75% coverage, the beating hot 95 turned into "a reasonable warm day to be outside". Maybe we dialed back to 80. The sky lost it's deep blue, and was just a muted version of itself. Everything was muted in an erie way that you can't quite describe.
Popsicle break
It was never going to get cold in Tennessee, but once we got past 75% coverage, the beating hot 95 turned into "a reasonable warm day to be outside". Maybe we dialed back to 80. The sky lost it's deep blue, and was just a muted version of itself. Everything was muted in an erie way that you can't quite describe.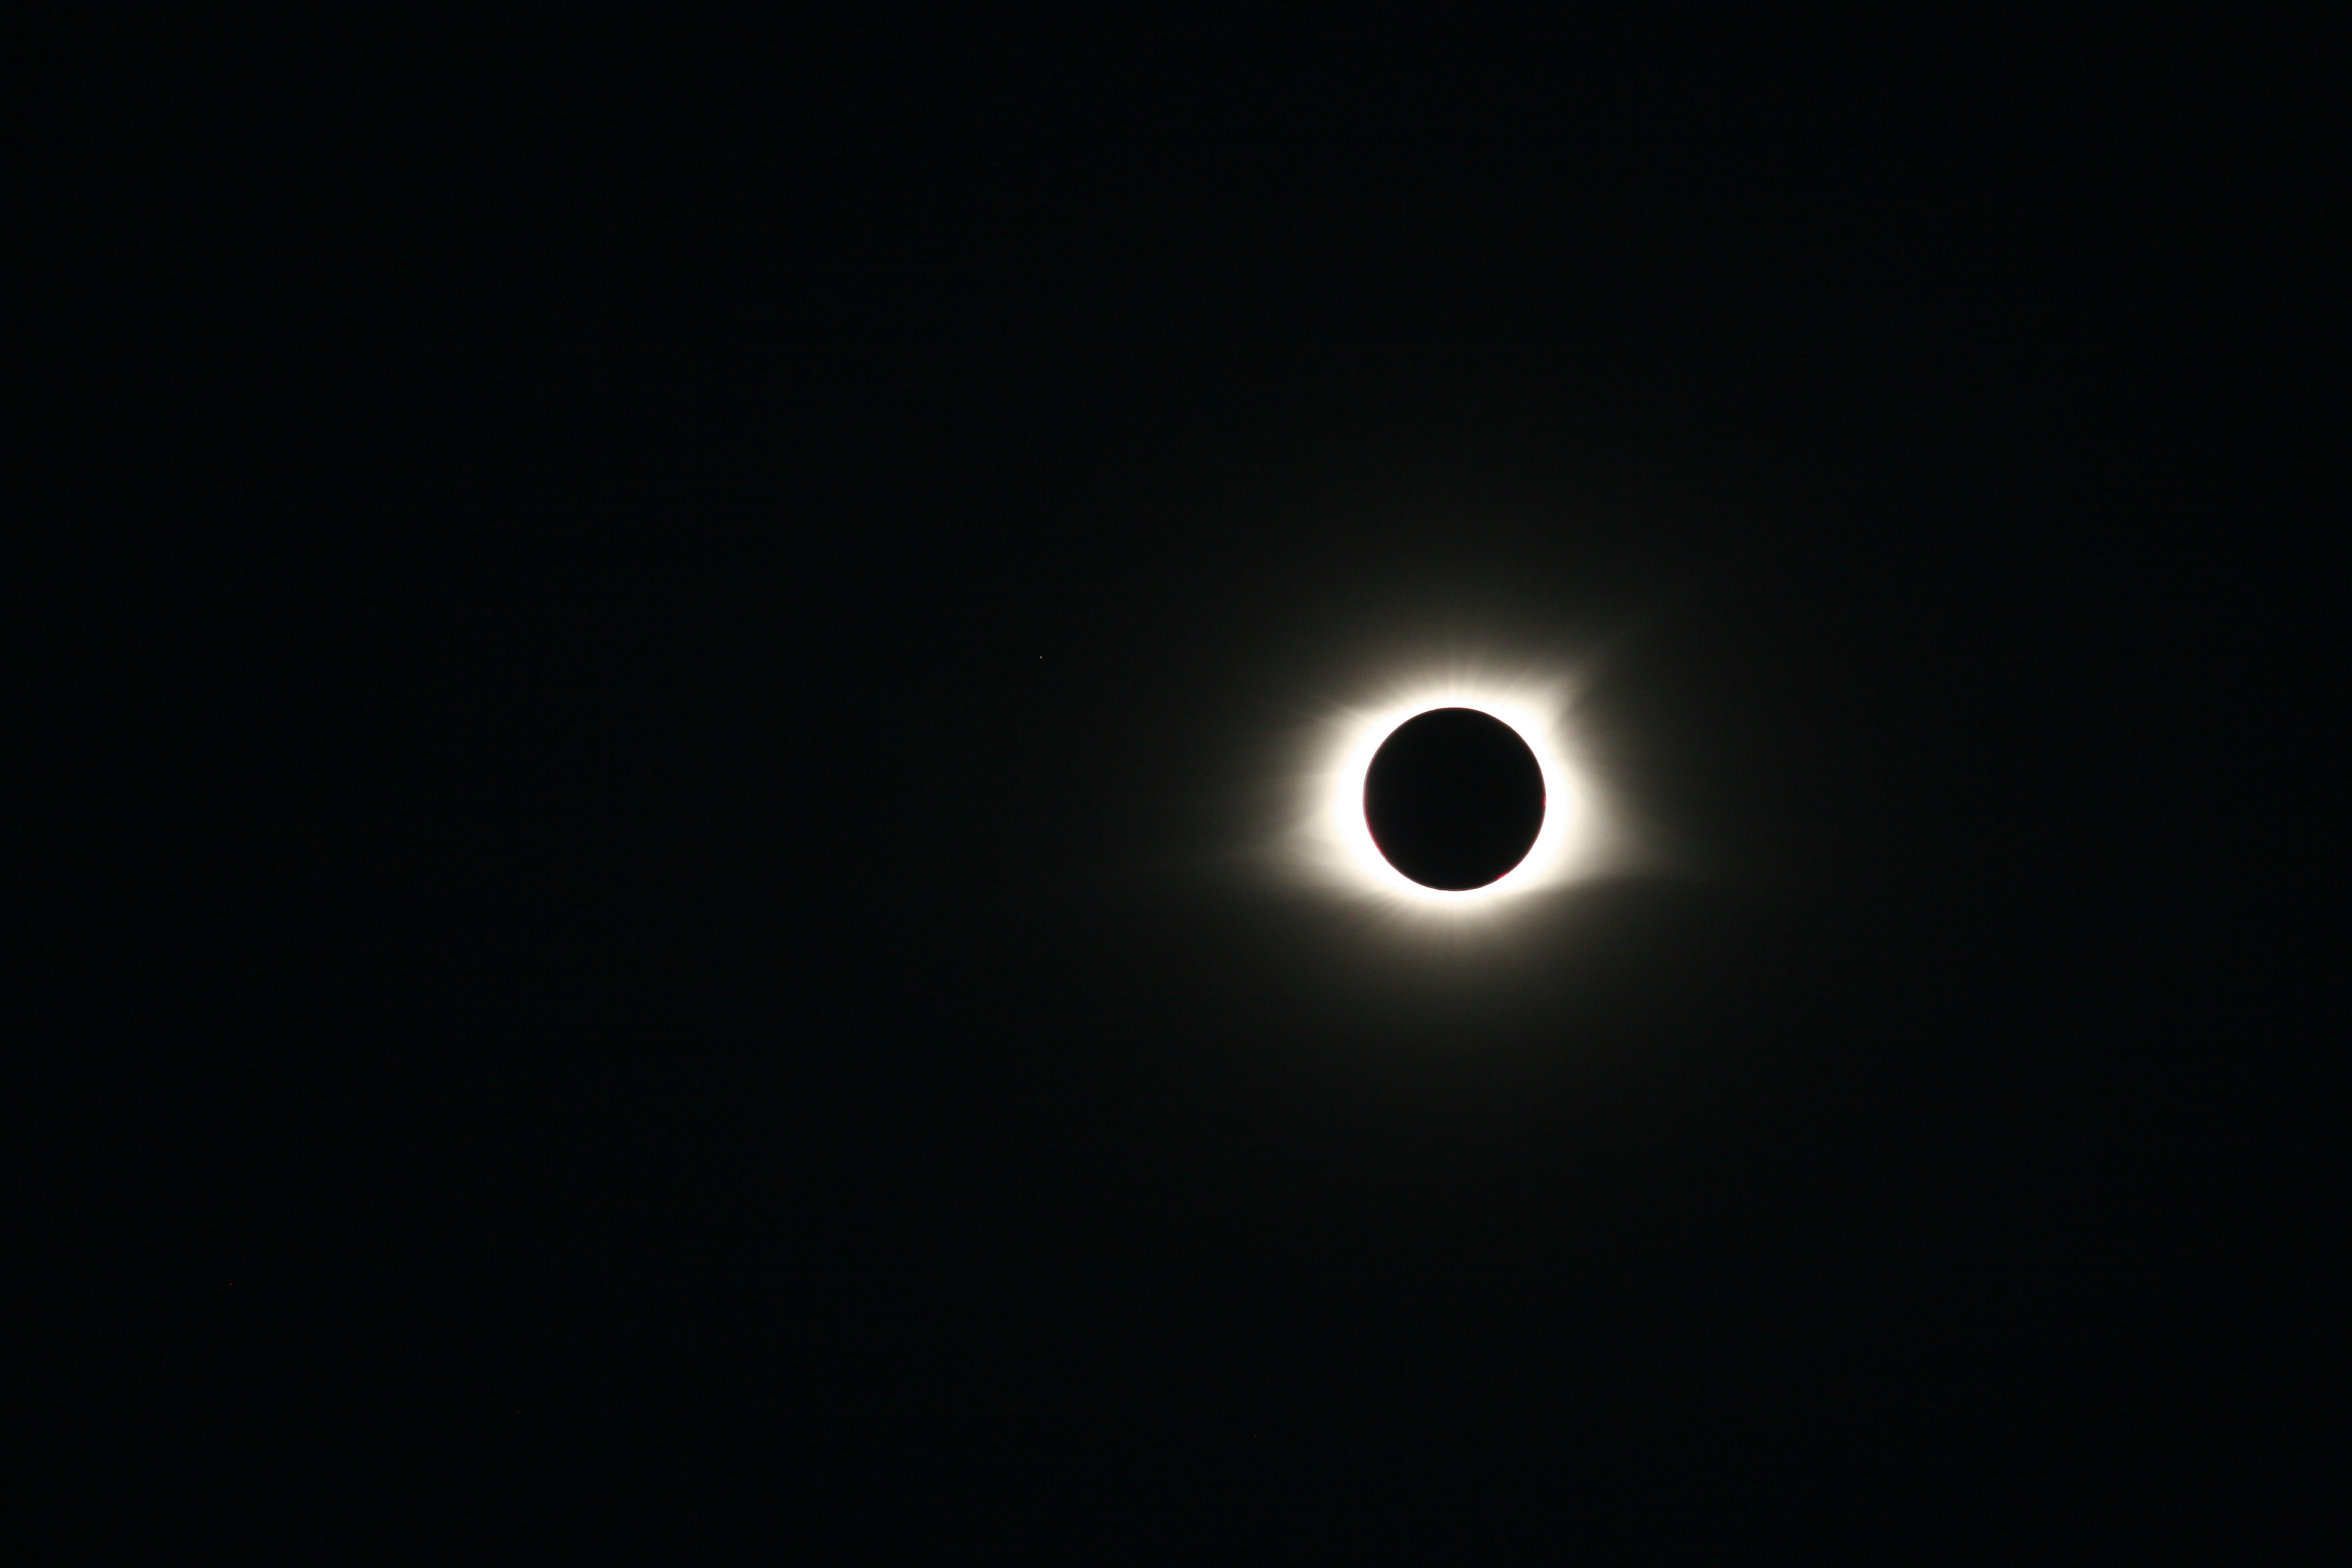 Our eclipse, courtesy Jack Chastain
Pictures don't ever really capture what the eye sees. Most of them show a small ring around the Sun. But this was a sun flower. The corona extended at least the radius of the Sun again. It wasn't uniform, it was sweepy with a few petals poking out. It was amazing. Everyone was exclaiming in different ways, processing this true wonder of nature in a way personal to them.
Our eclipse, courtesy Jack Chastain
Pictures don't ever really capture what the eye sees. Most of them show a small ring around the Sun. But this was a sun flower. The corona extended at least the radius of the Sun again. It wasn't uniform, it was sweepy with a few petals poking out. It was amazing. Everyone was exclaiming in different ways, processing this true wonder of nature in a way personal to them.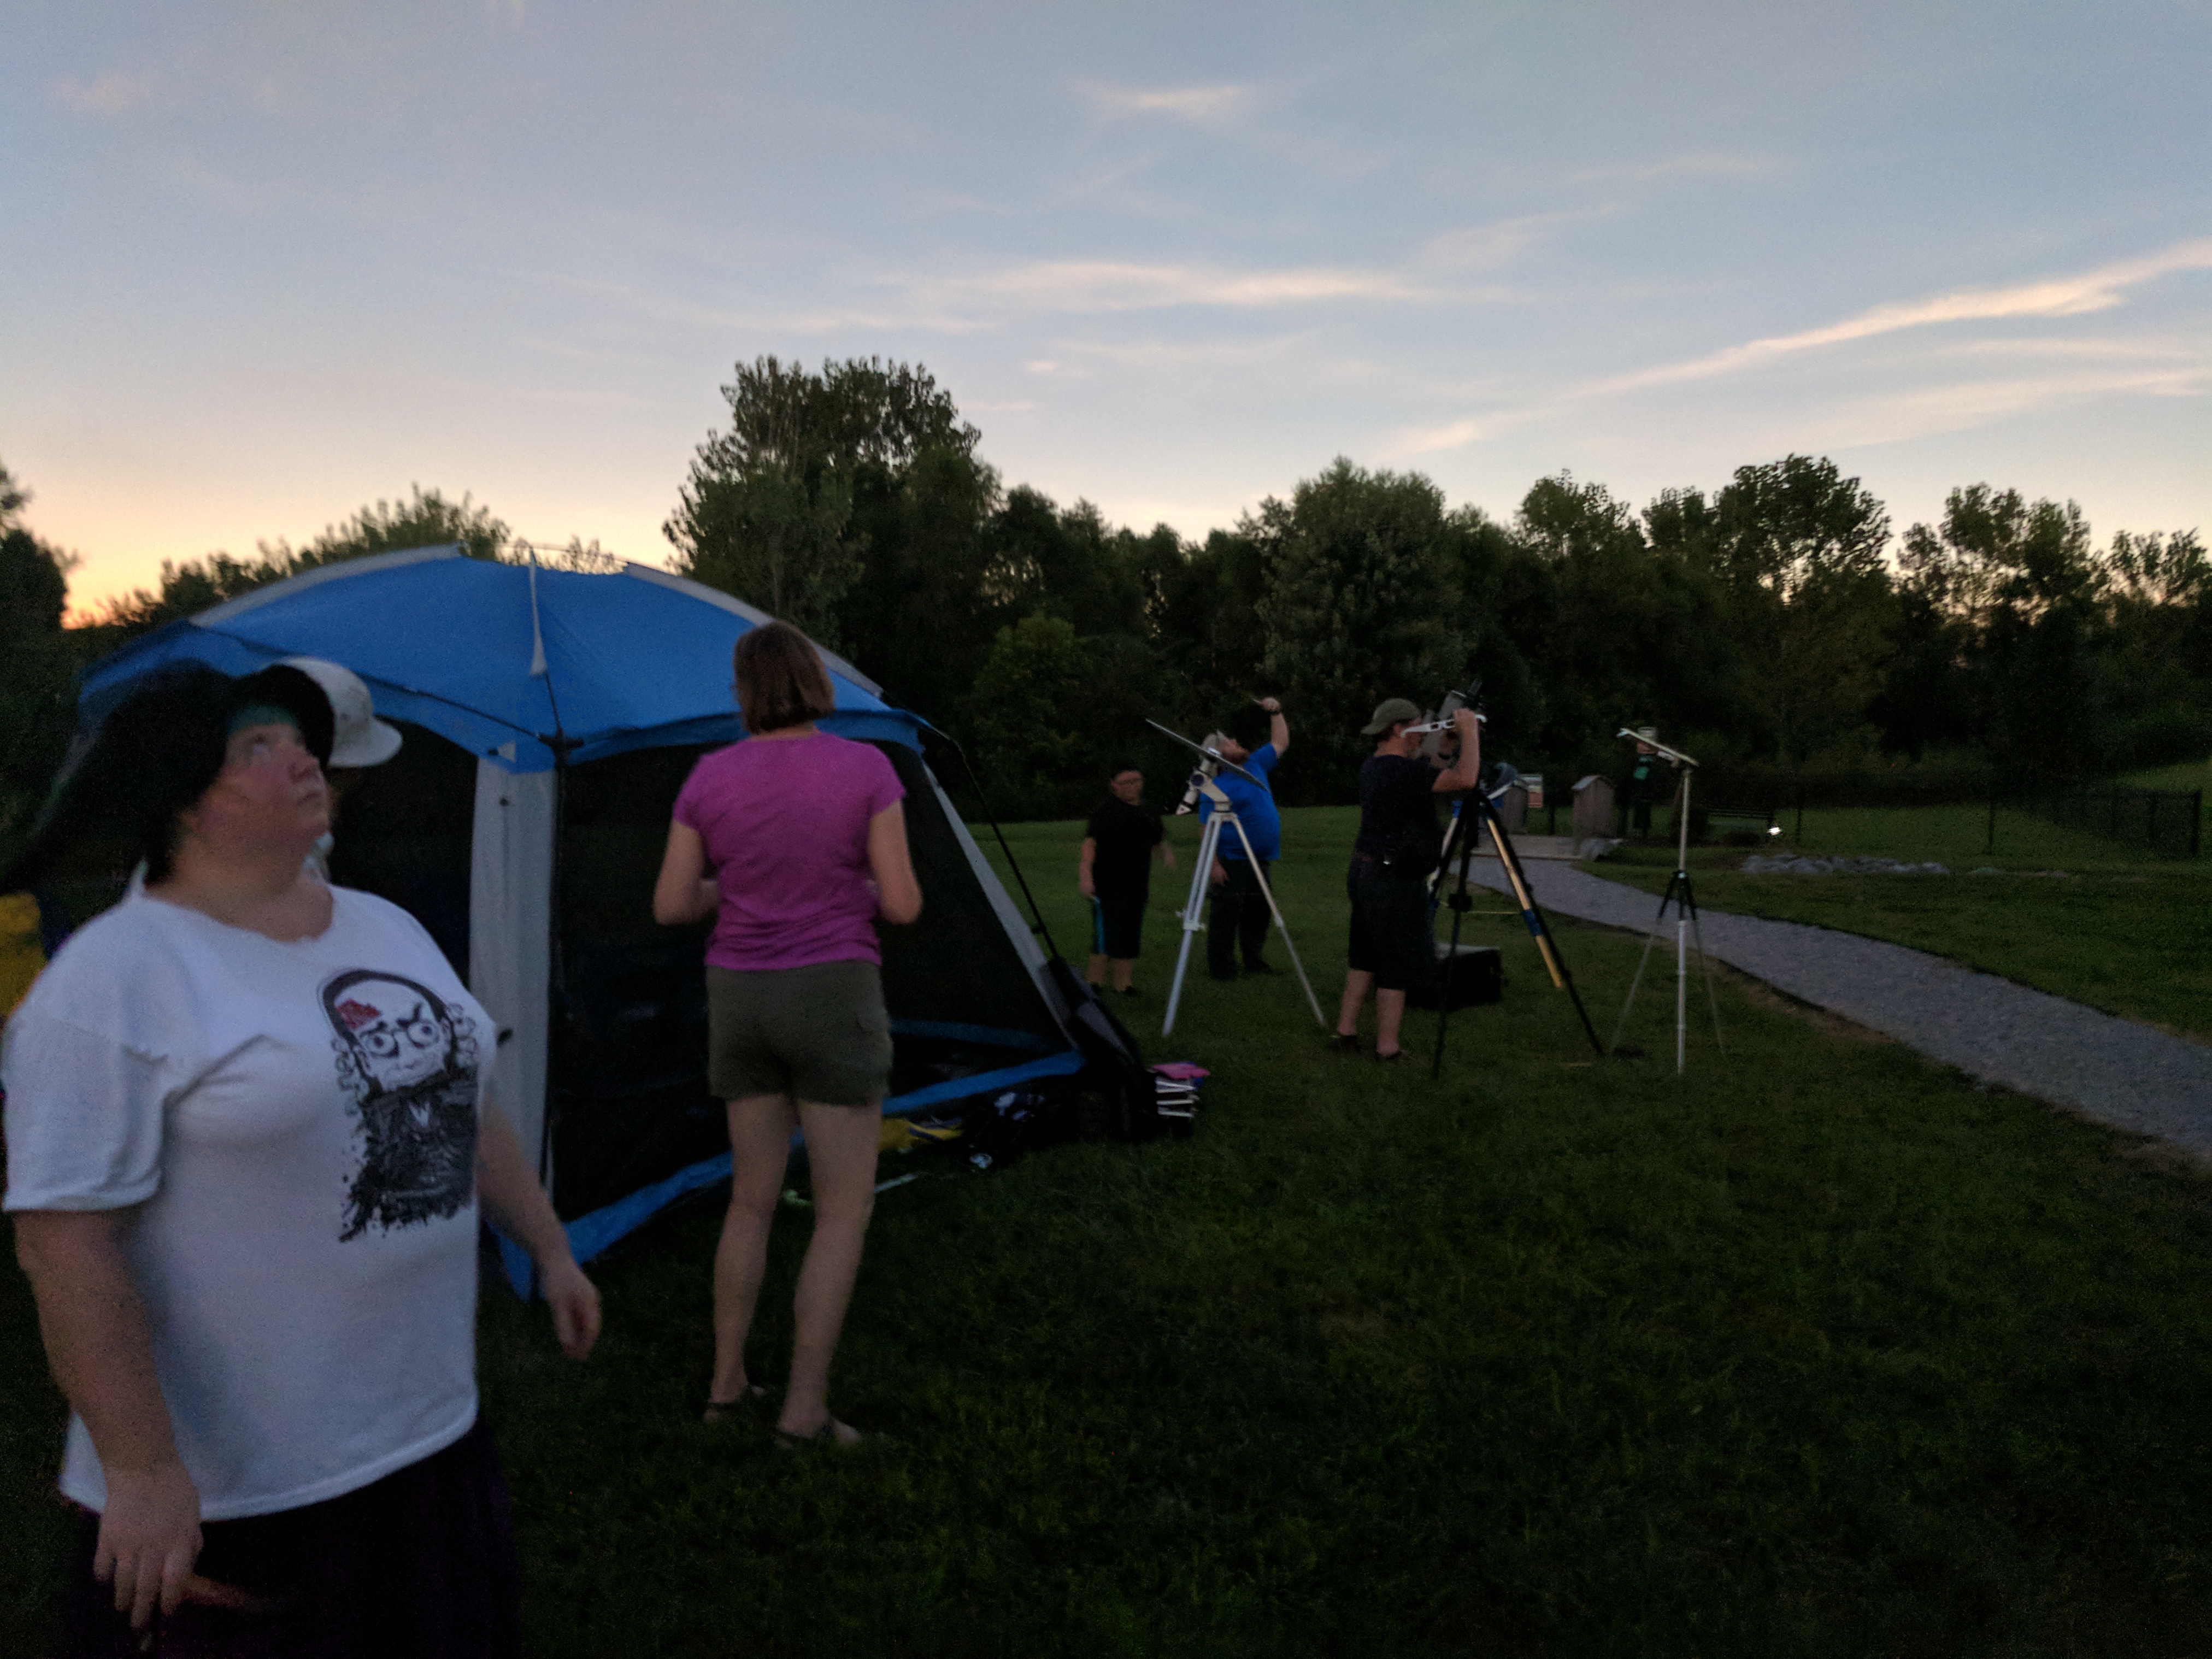 During totality
We got about two and a half minutes. It's not enough time. Not enough time to soak in this totally bizarre experience. It was about a minute longer than our daughter (not quite 3) was happy with. Both the dark, and the black hole in the sky definitely got her scared. She was not the only one, we heard another boy crying in one of the apartments behind us.
During totality
We got about two and a half minutes. It's not enough time. Not enough time to soak in this totally bizarre experience. It was about a minute longer than our daughter (not quite 3) was happy with. Both the dark, and the black hole in the sky definitely got her scared. She was not the only one, we heard another boy crying in one of the apartments behind us. The sun returns, with crescents through the bushes
And as the Sun returned, everyone dispersed. I spent the next hour helping Jack pack up and put things in his car. We all ended up back in the nice AC before the even was properly over, taking a last look at a 15% eclipse before going inside for more food and to crack a few beers.
The sun returns, with crescents through the bushes
And as the Sun returned, everyone dispersed. I spent the next hour helping Jack pack up and put things in his car. We all ended up back in the nice AC before the even was properly over, taking a last look at a 15% eclipse before going inside for more food and to crack a few beers. Eclipsee
 From the